HBAR approaches trendline, will it give a breakout?Bitcoin's Influence: As Bitcoin sustains above $34K, altcoins like HBAR are also showing bullish signs.
Current Status: HBAR is trading at $0.05276 with an intraday growth of 0.62%.
Double Bottom Reversal: HBAR price action indicates a double bottom reversal from $0.045.
Technical Indicators - MACD: The MACD indicator shows a bullish divergence and a crossover.
Technical Indicators - EMA: A potential golden crossover is on the horizon as the price approaches the 200-day EMA.
50-day EMA: A closing price above this level could propel HBAR to $0.069.
Weekly Performance: HBAR has seen a price jump of 15.47% over the last week.
Bullish Candles: 6 out of the last 7 days have shown bullish candles.
Triangle Pattern: HBAR is forming a positive trend within a triangle pattern.
Potential Targets: If the triangle pattern is broken, HBAR could reach $0.062 or even $0.080.
Psychological Mark: HBAR has reclaimed the crucial $0.050 mark.
Downside Risk: If the price fails to break the 200-day EMA, it could drop back to $0.045.
HBARPERP trade ideas

Will HBAR Reach $0.065?Double Bottom Reversal: HBAR price action hints at a double bottom reversal from $0.045.
MACD Bullish Divergence: The MACD indicator shows bullish divergence and a potential crossover.
50-Day EMA: A close above this level could propel HBAR to $0.069.
Triangle Pattern: HBAR is forming a triangle pattern in the daily chart, indicating indecisiveness.
Critical Support: The $0.045 zone is crucial for sustaining the triangle pattern.
Uptober Sentiments: Improving market sentiments make a bullish comeback more likely for HBAR.
Downtrend Motion: HBAR is currently in a downtrend, with the 50-day EMA acting as resistance.
Current Price: HBAR is trading at $0.04787, with an intraday growth of 2.12%.
Technical Indicators: MACD is bullish, while EMAs maintain a bearish outlook.
Golden Crossover: A positive cycle could lead to a golden crossover in EMAs.
Optimistic Scenario: If HBAR breaks the 50-day EMA, it could reach $0.065.
Pessimistic Scenario: Failure to break the EMA could lead to a drop to $0.040.

HBAR is close to bottoming.I think we'll see HBAR bottom out at the bottom trend line of the descending wedge pattern around the .0445 level. After this we will ascend to the top trend line hitting it somewhere around mid to the end of December. If HBAR price can break the upper wedge then hold on tight!

Bull | Bear Daily TargetsQuick and simple chart showing shorter term targets for the HBAR daily chart, bull and bear, with support and resistance.
I think there's a good chance at this point that we hit the area within the green box, likely on the dot on the top and bottom, prior to moving up.
However, there's still a possibility that we reclaim the uptrend recently lost, after having made a double bottom at 4.65 cents. Should that occur, then we head up much sooner.
Either way, when we head up, the resistance area will begin and end at the first two bull targets, or the bottom and top of the red box.
It is crucial that HBAR get above ~11.6 cents to see a stronger move, and it will again begin to face resistance around 15-17 cents before getting a chance to move up near its old bull market highs.
Just the same, it really needs to hold ~3.46 cents, or we could see a stronger move down below 3 cents.

HBAR 1W coiling up for 140%+ moveHbar 1W chart looking amazing. Coiling up to breakout in the next few weeks/months. Definitely a great project with great fundamentals as well. Keep your eye on this one when it rips

HBAR 7:1 Long Swing Trade @ Below Accumulation PricesA few of my thoughts about Hedera Hashgraph and its near term price action are charted here, which I hope you will challenge with tough questions. After all, these ideas of mine are meant to arouse the reverse-engineers and to provoke the thinkers to do what they do best. As always, I strive to render them so obviously as to require no words.
Nevertheless, HBAR has been at these attractive prices (+/- $ 0.50) for an eerily long time, considering the rally that has taken place this year for Bitcoin and several of the other "usual suspects" that lack utility and/or user-facing marketing campaigns. Currently, the 7:1 Long trade is merely one of many setups that are coming into focus as the ongoing accumulation phase comes to an end.
Although my trading strategy is built on innate Pattern Recognition and a hard-won sympathy for the Market Maker’s Business Model, my tactics - including the beauty of Tradingview and how it makes me look good - are based on identifying the opportunities within VOLUME, VOLATILITY and TREND EXHAUSTION.
As always, it must be noted that harmonic patterns are NOT confirmed until the D-point prints, ergo trading the CD leg is especially risky, and requires real-world context not available on the naked chart ... ergo DYOR.
In this case, the Median line of a Pitchfork generated by the completed bullish reversal pattern (Green M) also marks the A-point of the currently forming bearish reversal pattern (Red W). Furthermore, the 2.718 Fibonacci extension of that pitchfork implies a time estimate for completion of the current pattern.
Keen observers will note that the Long trade idea on display does NOT extend as far as the D-point, but instead has its profit target the 2nd Standard Deviation of the VWAP generated by the A-point, where price may be expected to roll over.
I intend to publish a more comprehensive video surveying the current swing trade setups and medium term opportunities in crypto projects, although it must be admitted that there aren't many. First, though, I have a few more ideas to upload as I update other key charts for the final Quarter of 2023.
Until then, be liquid !!!

HBAR is going to do very well over the next few months.HBAR is looking really good on the technicals. HBAR will do really well for those who are patient and can hold a position for multiple years to a decade.

Will HBAR Price Escape The Channel?HBAR price action finds a bullish reversal at $0.050.
The MACD indicator indicates a bullish crossover.
A closing price above the 50-day EMA could propel HBAR to $0.069.
HBAR coin price saw a sharp recovery from $0.40 to $0.75.
Overhead supply pressure caused a bearish breakout from the rising channel pattern.
The price dropped to $0.045, marking a 30% drop within a month.
The downtrend prevented a golden crossover between the 50-day and 200-day EMA.
A bullish reversal is forming with a morning star pattern at $0.045.
The current HBAR coin price is $0.053175.
The 4-hour chart shows a bearish channel pattern.
A bullish breakout is anticipated, but a sideways trend might occur first.
If prices don't surpass the 200-day EMA, a retest of the $0.044 support level is likely.

HBARUSD Short-term buy opportunityHedera (HBARUSD) is having a 3-day 1D candle bullish streak for the first time since the August 15 High. Considering the completion of a Bullish Cross on the 1D MACD and the fact that the 0.04555 level (Support 1) held, we treat this as a similar buy signal with March 16.
That fractal rose up to the 0.5 Fibonacci retracement level. That is our short-term target (0.06050) towards the end of the month.
-------------------------------------------------------------------------------
** Please LIKE 👍, FOLLOW ✅, SHARE 🙌 and COMMENT ✍ if you enjoy this idea! Also share your ideas and charts in the comments section below! **
-------------------------------------------------------------------------------
💸💸💸💸💸💸
👇 👇 👇 👇 👇 👇

HBAR BearishHBAR is looking to push lower into the .045 range of market structure. Price is currently under the 20, 50, and 200 MAs. Bitcoin is facing more downside pressure as bulls are being squeezed.
In the past 24 hours , 34,248 traders were liquidated , the total liquidations comes in at $102.36 million.
HBAR has had some positive news recently with securing partnerships with Carbon based initiatives. This brought in enough volume just to sell to.
Good news in crypto often results in price decline due to liquidity. Until the crypto markets become regulated, you will see these fluctuations more often.

Inverted HS Targets ~11-13.5 centsHedera Hashgraph daily chart may be forming an inverted HS here targeting at least 10-11 cents, and possible 13.5 or so.
This idea lines up with other longer-term charts published, which also target 10-11 cents and expect a move back into weekly resistance should that level hold up.
See related ideas in the links below.

HBAR short As Bitcoin goes lower alt coins will make new lows. HBAR broke a support at 0.056 and retested now the downwards is likely to continue until the next support area at 0.042

HBAR: Broadening Wedge with Sale TargetHBAR is trending within a rising expanding wedge. This is in itself a bearish pattern. Add in a failed demand test at trend support and we have a double confirmation of more blood to come. In the event of a sell off I've provided a sell zone that coincides with the mitigation point of the SCLX (range selling climax). Normally in distributions/redistributions the PA comes back down to revisit this point as an LPSY (last point of supply) after a UTAD top out. For those who can short crypto, this is a good place to either: 1. Take Profit, or 2. Sell. It is possible the price may sink further; these target zones are only suggestions. Note: another leg up within the wedge may also happen before the breakdown to retest SCLX. Please DYOR.
LIKE and SUBSCRIBE if charts like these are beneficial to you.
Stop getting smashed and start winning in crypto. My charts will teach you how! If you like big wins and big money, be sure to SUBSCRIBE to this channel. Here's why: I track all USD-paired cryptocurrencies on all the major CEXs and seek out the most lucrative swing trades. All my charts are clean and easy-to-follow with exceptional win rates ranging consistently between 80-85%. Check out my chart history and see for yourself.
I've been a full-time cryptocurrency swing trader and investor since 2017. My technical analysis is based on a combination of Wyckoff, VSA, EWT & Fibonacci ratios. I never shill and only chart crypto assets I invest my own money in. My success over the years has allowed me to do this full-time. You are welcome to piggy-back my strategies at your own risk.
**Not a financial advisor. Always DYOR and trade at your own risk.

HBAR long term holdThis is a longer term hold for me, I like how HBAR has been reacting to the latest crypto slide, an old cross on the weekly MACD is holding up well and RSI is showing strength on the larger time frames.

My next buy...HEDERAHBAR is one blockchain that has many corporate adoptions - many large US blue chip companies are on the council of HBAR and they're funding HBAR since day one. HBAR is part of the ISO coins
This is one I found on August 6, “Keep an eye on, don’t neglect HBAR” - current price 0.06066 on my chart.

about timewe could see a push to .074-.077
we may even push to .09 before seeing a pull back, but most will take profit at the .074-.077
preparing for a nice cup of tea with the cup and handle pattern.
lets watch and keep an eye on it.
good luck and have fun with it

HBARUSD Textbook Channel Up pull-back. Buy above Resistance.Hedera (HBARUSD) hit today the top of its 3 month Channel Up. Such Higher Highs have called within this pattern for a pull-back to the 1D MA50 (blue trend-line) for the most optimal buy entry. If a 1D candle closes above Resistance 1 (0.07000) before such pull-back, we will have a new pattern emerging and we will buy the break-out, targeting Resistance 2 at 0.077950.
-------------------------------------------------------------------------------
** Please LIKE 👍, FOLLOW ✅, SHARE 🙌 and COMMENT ✍ if you enjoy this idea! Also share your ideas and charts in the comments section below! **
-------------------------------------------------------------------------------
💸💸💸💸💸💸
👇 👇 👇 👇 👇 👇

Remains Bullish Above the WedgeHBAR will remain bullish as long as it remains above the wedge it broke out of. This is a re-draw of the previously posted wedge that I think makes a bit more sense.
Should it stop moving down anywhere above or within the green box, I'll expect it to continue up towards targets marked on the chart above - TP 1 and 2.

HBAR is a Sleeping GiantI have had this analysis for a while and today I gave up to the FOMO. Buying HBAR at these prices is like buying ETH at 100 dollars. No financial advice, DYOR

HBAR/USD - Hidden Bullish Divergence?*Important - Once majority bashes crypto and calls it a scam calling for lower targets (like how many did in 2018 and missed out), that is when I will be all in!
Whales/elites will not miss any opportunities into making money. They simply buy the fear, hype up the market, take profit and crash it again after taking profit. Instead of beating then, lets ride with them! ;)
Majority got Rekt last year due to listening to the "Bullish" Narratives the media and Social Media Influencers were portraying last year! Stop listening to them and start paying attention to the technicals.
Before reading, get rid of your moonboy mentality and no emotions for dips/corrections! Cannot rule bearish scenarios! Dips are for buying!!
People are so focused on the hourly/daily timeframe that they get emotional on every dip! Take a step back to the weekly/monthly timeframe and see why I'm so bullish now. Stop looking at the short-term dips/rise. Short term is irrelevant for the move that is coming!
You can't be emotional in these markets (stocks, forex, crypto, real estate, etc.). You will lose this game following the news and doing what the majority does. News creates emotions. Everything you need to know are on the charts. News is manipulated by the elites, and they take advantage of our emotions. Stop listening to the news and pay more attention to the charts. Don't follow the majority, because the majority will lose in the end! Also, don't buy the hype when everyone is buying.. instead buy the fear when everyone else is selling
Everything is on the chart! Cryptocurrencies are on the verge of exploding higher. Dips/Corrections are normal and needed in a bull market and are buying opportunities! Huge gains opportunity in the coming years! Never trade blindly. Use multiple indicators to make calculated decisions. Trade with no emotions!
"If you can't beat the fear, do it scared!"
"Be fearful when others are greedy, and greedy when others are fearful!" - Warren Buffet.
"Markets are a device for transferring money from the impatient to the patient. - Warren Buffet
"Show me the charts, and I'll tell you the news." - Bernard Baruch
"The secret to investing/trading is figuring out how rich you want to be and how poor you're willing to become."
"If you want to live like the 5% of the population who are hugely successful, then don't act like the 95%!"

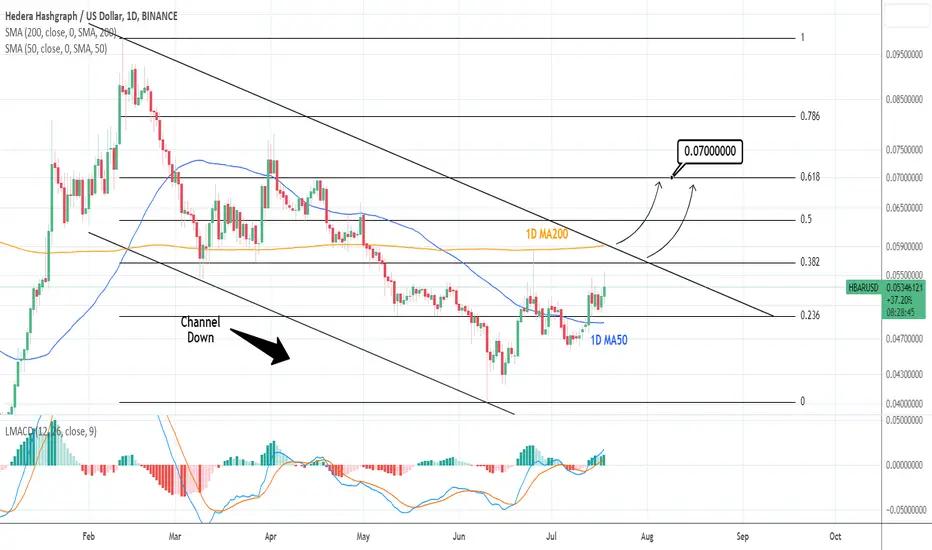
HBARUSD: Is ahead of a big long term bullish breakout.HBARUSD is above its 1D MA50 but still inside the February Channel Down, restrained under the 1D MA200 but with the 1D technicals bullish (RSI = 62.752, MACD = 0.001, ADX = 27.218). The 1D MA200 has been unbroken since May 2nd so it is our technical trigger. A cross over it, will be a buy entry, targeting the 0.618 Fibonacci level (TP = 0.0700). An early bullish indication comes from the 1D MACD, which is turning upwards in contrast with the sequence on the last bullish leg that turned downwards on April 17th.
## If you like our free content follow our profile to get more daily ideas. ##
## Comments and likes are greatly appreciated. ##
Adam & Eve for HBAR.10 cents HBAR is inevitable at this point. Stochastics also point to it. Big mover for the upcomming bull market.

Possible Dips before a Move UpThis is a 4h view of the daily chart, which has already broken out of a falling wedge. That breakout has created a smaller falling wedge as it has re-tested the top of the daily wedge multiple times since breaking above it.
Following its initial breakout, it formed and inverted head and shoulders, and looked ready for a bullish move up. That pattern failed and we've since moved down to the failed HSi's TP1.
From here, if there are any further dips and we don't just break out of the smaller wedge, I expect we'll do something like what is shown above:
Option 1 - A symmetrical right shoulder that drops down to around 4.5 cents and then moves up
Option 2 - Continuation of the inverted HS and a move down to its TP 2, for a final re-test at the top of the daily wedge, and then a move up
Here's a zoom out to the daily chart and the larger wedge break:
See related idea in the link below.
