Hedera Hashgraph Perpetual Futures forum
This tariff b.s is nothing but a blessing, and a negotiation tactic this country should have implemented many years ago, against other countries taking advantage of the U.S.
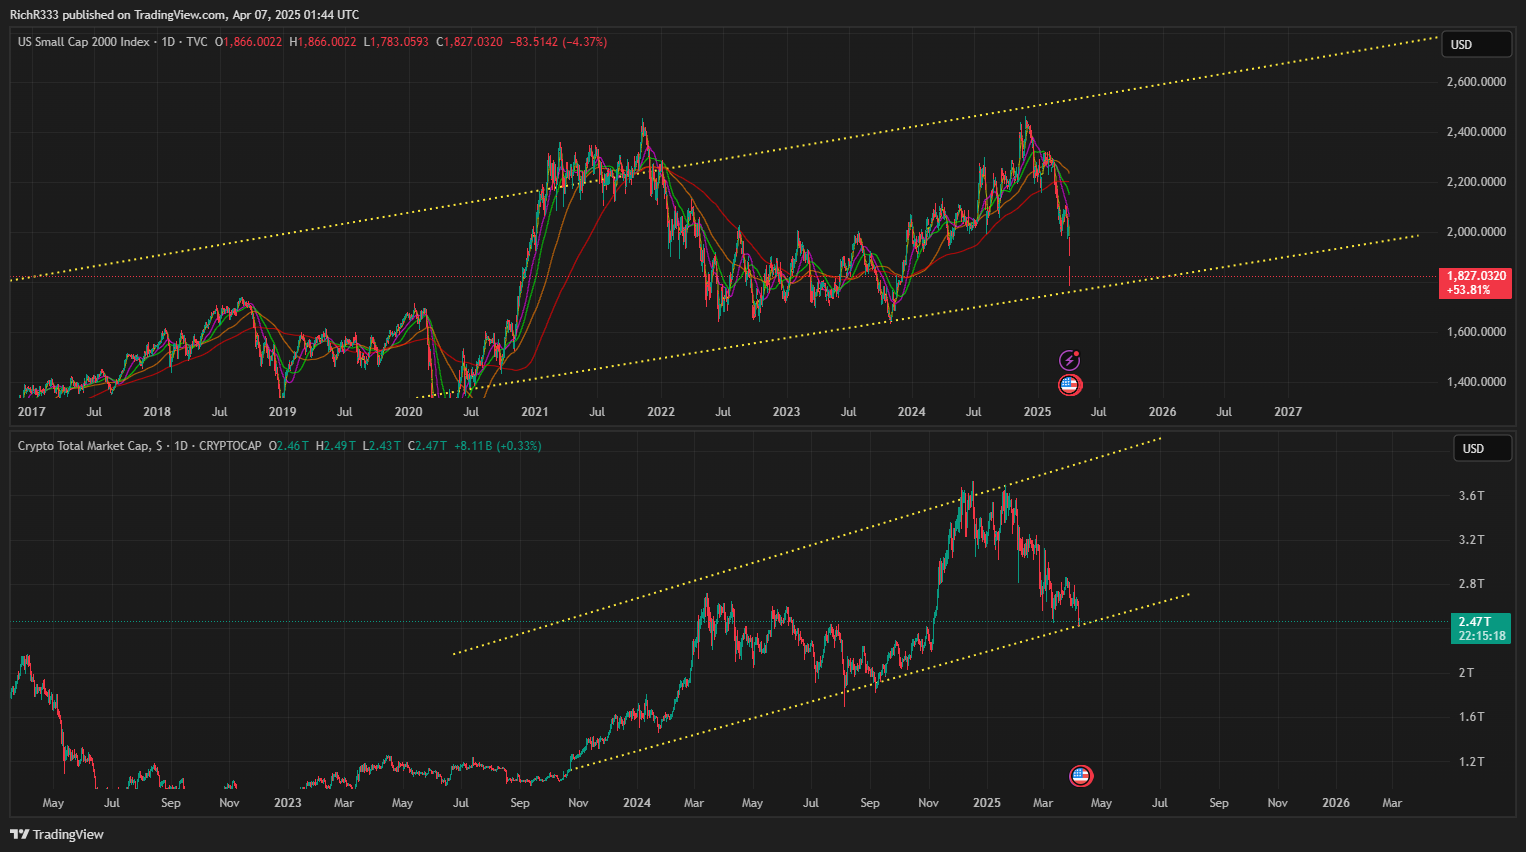
"but someone had to do it!" lol. Seriously, read the charts and chill out.
Over 50 countries and counting have already begun the first steps in negotiation the last few days. I will be patiently waiting and stacking more in the meantime. GLTA!

Key Takeaways:
Breakout confirmed with high volume, showing strong buying pressure.
Next resistance levels: $0.215 - $0.22 range.
If momentum continues, $0.225+ could be next, but watch for pullbacks.
Support now flips to $0.205—if price retests and holds, it confirms strength.