Ignore this Macro Gold ideawhat are the chances that price breaks out, retests resistance and goes to the moon? Small I'm guessing.
2840 trade ideas


GLD Gaining Momentum – Key Technicals & Options Insights Technical Analysis (GLD):
* Trend Overview: GLD has been following an ascending channel, with price action respecting the upper and lower bounds.
* Support Levels: Immediate support lies at $262.50, followed by stronger support at $257.87.
* Resistance Levels: The price is currently testing $265.99, the upper resistance of the channel. A breakout above this level could push GLD toward the next target at $270.00.
* Indicators:
* MACD: Shows a slight bullish momentum, though slowing down.
* Stochastic RSI: Overbought at 98.14, suggesting potential consolidation or retracement.
Options GEX Analysis:
* Gamma Exposure (GEX): The highest positive gamma sits at $270, marking a strong resistance zone.
* Key Put Walls: Located at $243 and $240, providing robust support in case of downside.
* Call Wall Resistance: Options traders are showing interest at $270, likely acting as a significant cap unless the price breaks out with strong volume.
* IV Data:
* IVR: 69.3 – Elevated, signaling relatively higher premiums.
* IVx avg: 17.8 – Indicating the overall sentiment aligns with slightly cautious optimism.
Suggestions:
* Bullish Scenario: A breakout above $265.99 with volume confirmation could see the price rally to $270.00. Consider call options with stops near $264.50 to manage risk.
* Bearish Scenario: If resistance at $265.99 holds, a retracement to $262.50 or $257.87 is possible. Protective puts or short positions could be considered, with tight stops above $266.00.
* Neutral Play: Selling options (iron condors or spreads) between $243–$270 can benefit from the current IV levels and defined range.
Conclusion: GLD is at a critical juncture. While the overall momentum leans bullish within the channel, caution is warranted due to overbought conditions and resistance at $265.99. Monitor for volume and price action near these levels for clearer trade entries.
Disclaimer: This analysis is for educational purposes only and does not constitute financial advice. Always perform your due diligence and consult a financial professional before trading. 📊✨

Gold price is going to correct soon. long term TP: 269, 302 andAs trade tensions, economic uncertainty, and geopolitical conflicts escalate, gold’s price movements will be the most reliable indicator of investor sentiment.
With tariff battles intensifying and China realigning its trade alliances, the traditional financial system may be entering a new, volatile phase. If history is any guide, gold may be the only true measure of global anxiety—and the only real insurance policy against economic upheaval.
📈 Gold remains the ultimate hedge in a fractured world. Watch its price—because it just might predict the future.
Gold price is going to correct soon. long term TP: $269, $302 and $345

GOLD MAJOR TOP this is the ALT due by 2/3 The chart of GLD has an alt bearish count . The chart labeled shows a 5 wave wave up and at todays high it is a perfect x 1.272 to = at 259.7 I have now moved to a 100 % long in the money PUTS> if how ever we close above 261.8 I would then look for the Original target of 265 plus I will Hold in the money puts best of trades WAVETIMER


Looking For More Upside In GLDI have talked about gold before in some articles I wrote both on my website and on TV. It was a great entry for a long term move based on seasonality, macro and technical setup. I have since been able to move my risk to profitable. Now, gold has pulled back from the top of keltner channel offering a nice swing opportunity.

GLD UpdateGold seems to be intent on continuing to rise. This make me wonder if the ALT is correct. For those that don't remember, the ALT suggested that wave 4 was already over and was shallow. In order for wave 4 to have alternation with 2 though, it should be deep. We will just have to wait and see, but to me this thing has two possibilities for the ensuing pattern.
The first (white count) is that this raise from the $234 bottom has been a deep b wave. If this is the case, it should be turning around very soon and heading lower again. The second (turquoise count) suggests that wave 4 is already over and wave 5 has begun. The turquoise labels are tracking the possible impulsive pattern. Time will tell but GLD moves slowly most of the time so be patient.

GLD cup and handle bullish breakout Gld currently in a consolidation phase. Forming a cup and now handle, a breakout gives a price target of 260$ with a stop at the bottom of the handle at 245$ this gives a 3:1 risk reward trade set up. And a new ATH for GLD

GLD cup and handle Gld currently in a consolidation phase. Forming a cup and now handle, a breakout gives a price target of 260$ with a stop at the bottom of the handle at 245$ this gives a 3:1 risk reward trade set up. And a new ATH for GLD

Contrarian Sentiment Signal in Gold (GLD)This chart highlights the significance of contrarian sentiment indicators in identifying potential buying and selling opportunities in gold (GLD). The sentiment indicator below the price chart oscillates between -100 (extreme pessimism) and 100 (extreme optimism). Historically, extreme pessimism sentiment levels have marked pivotal turning points in gold's price action.
Key Observations:
Contrarian Buy Signals (Extreme Pessimism):
Around 2015, 2018, and 2019, extreme pessimism (-100 sentiment) coincided with major bottoms in GLD prices. These were ideal long-term buying opportunities as gold subsequently rallied significantly.This behavior underscores the value of using sentiment as a contrarian tool, where extreme fear often leads to mean reversion or trend reversals to the upside.
Potential Exit Points (Extreme Optimism):
This chart highlights key potential exit points for gold (GLD) traders and investors, marked by the yellow arrows. These exit points align with significant price peaks where momentum began to stall, often signaling the end of strong bullish trends. These signals are based on price action and historical resistance levels, rather than sentiment extremes, offering an actionable approach for managing profits during rallies.
Current Sentiment and Price Action:
As of now, gold sentiment is at a high level (71), suggesting optimism but not yet at the extreme threshold of 100. The current price action is near the recent highs, and traders should monitor sentiment closely. A surge toward 100 could signal a potential top, while a decline in sentiment could reset conditions for another leg higher.
For Bulls:
If gold experiences a short-term pullback and sentiment drops significantly (below 0 or even -100), consider entering long positions with a focus on support levels near $200 or $180.
Use trailing stops to protect gains if gold continues to rally without reaching extreme optimism.
For Bears:
If sentiment surges toward 100, consider taking profits or opening short positions with tight risk management.Watch for bearish divergences between price and sentiment to confirm potential tops.

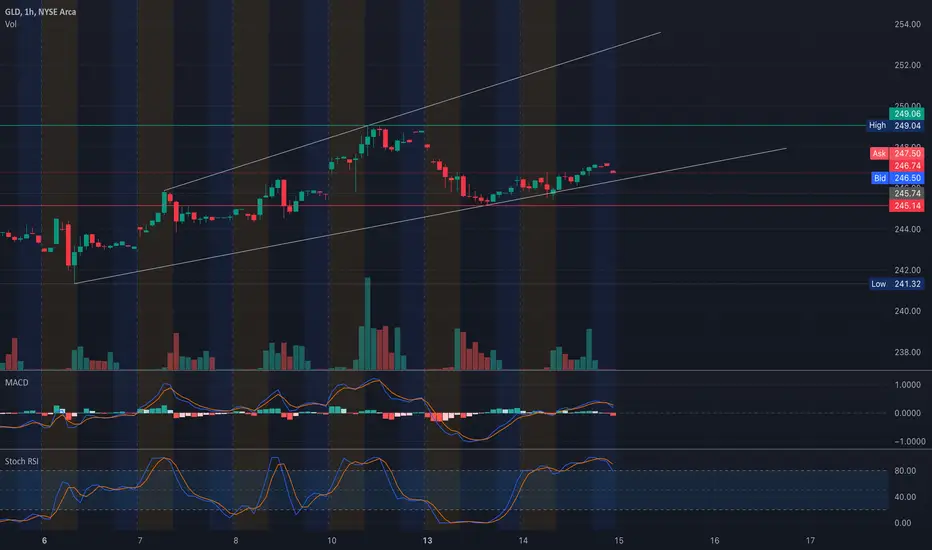
GLD Approaches Key Resistance! Will the Rally Continue?"Technical Analysis Overview:
1-Hour Chart:
* Trend: GLD is in a steady uptrend, trading within a rising channel and approaching the $248-$249 resistance zone.
* Indicators:
* MACD: Slight bullish momentum, but the histogram is flattening, indicating reduced strength.
* Stochastic RSI: Overbought at 89, suggesting a potential short-term consolidation or pullback.
30-Minute Chart:
* Price Action:
* GLD is consolidating near $247, with key resistance at $248-$249.
* Immediate support at $245 has shown strength in recent sessions.
* Volume: Moderate volume, consistent with the gradual upward movement.
Key Levels to Watch:
Support Levels:
* $245: Immediate support zone, aligning with the HVL and 2nd PUT Wall.
* $243: Secondary support, coinciding with the 2nd PUT Wall (-5.96% GEX).
* $240: Strong support near the 3rd PUT Wall.
Resistance Levels:
* $248: Immediate resistance, aligning with the 2nd CALL Wall.
* $249-$250: Key resistance zone, highlighted by the highest positive NETGEX.
* $253: Long-term resistance, supported by the 3rd CALL Wall.
GEX Insights:
Key Gamma Levels:
* Positive Gamma Walls (Resistance):
* $248: 56.42% GEX (2nd CALL Wall).
* $249-$250: Highest positive NETGEX and immediate resistance.
* $253: 39.99% GEX (3rd CALL Wall).
* Negative Gamma Levels (Support):
* $245: Immediate support backed by HVL and gamma support.
* $243: Strong support with PUT activity (-5.96% GEX).
* $240: Key PUT Wall support (-2.96% GEX).
Options Metrics:
* IVR: 57.2, indicating relatively high implied volatility.
* IVx: 15.2, below average, signaling a stable environment.
* Call/Put Bias: Calls dominate at 49%, reflecting bullish sentiment.
Trade Scenarios:
Bullish Scenario:
* Entry: Above $248 with volume confirmation.
* Target: $249-$253.
* Stop-Loss: Below $245 to limit risk.
Bearish Scenario:
* Entry: Rejection at $248 or a breakdown below $245.
* Target: $243-$240.
* Stop-Loss: Above $249 to control losses.
Directional Bias:
* GLD's continued uptrend and consolidation near $247-$248 suggest bullish momentum, but the resistance zone at $248-$249 is critical. A breakout could lead to a rally toward $250-$253, while a failure to clear resistance may result in a pullback toward $245-$243.
Conclusion:
GLD is approaching a pivotal resistance zone at $248-$249. A breakout could signal further bullish continuation, while a rejection might trigger consolidation or a retracement. Traders should monitor volume and price action closely for confirmation.
Disclaimer:
This analysis is for educational purposes only and does not constitute financial advice. Always conduct your research and trade responsibly.
$GLD - GOT GOLD?!AMEX:GLD - GOT GOLD?!
Day/ Week/ Month all breaking out!
- Green H5 Indicator
- Two symmetrical triangle breaking out
- Daily WCB thriving
- Launching off volume shelf
- Safe haven when FUD hits
All pointing to measured move: $268 🎯
Not financial advice

GLD gold bull flag monthlyThis is actually pretty insane to look at, this bull flag is text book, and multi month. What does this tell us about the markets for 2026? Are we really getting a whole market pump?

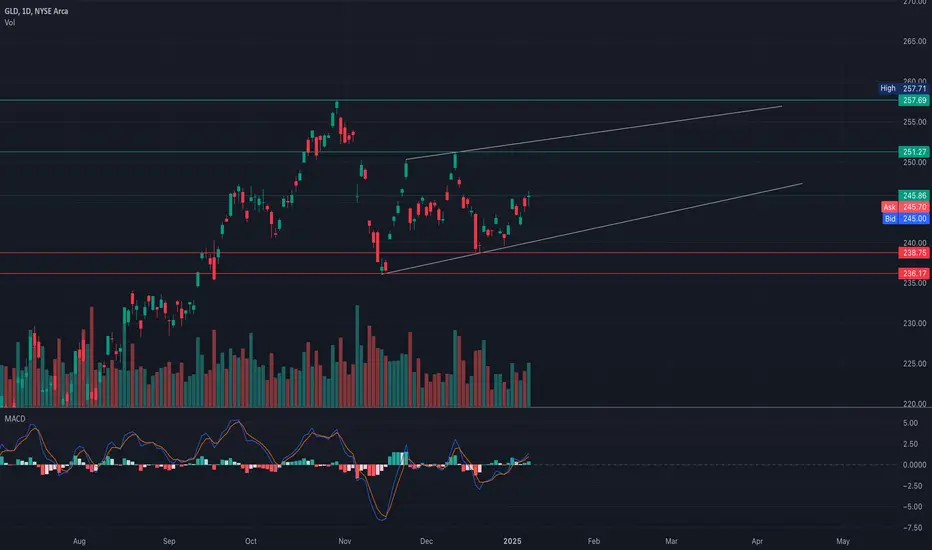
GLD Technical Analysis (Daily & 30-Min Chart)Daily Chart Analysis:
* Trend: GLD is trading within an ascending channel, with higher lows and higher highs forming a bullish structure. The price is approaching the upper resistance line near $257.71, indicating a potential test of this level.
* Support Levels:
* $245.86: Current price zone showing consolidation.
* $238.75: Key swing low, acting as a strong support level.
* $236.17: Major support to watch if a bearish breakdown occurs.
* Resistance Levels:
* $251.27: Intermediate resistance before testing the channel high.
* $257.71: Upper channel resistance.
* Indicators:
* MACD: The MACD is showing bullish momentum with a crossover above the signal line, indicating potential upward continuation.
* Volume: Increasing volume on bullish days suggests strong buyer interest.
30-Min Chart Analysis:
* Gamma Exposure (GEX) Levels:
* $246.45: Highest positive NET GEX and CALL Resistance (Gamma Wall). If the price breaks above, expect bullish continuation.
* $245: Current price zone with balanced sentiment, acting as a pivot level.
* $242.5: Major support near the 3rd PUT Wall, indicating strong buyer interest at this level.
* $241: PUT Support and likely defensive zone if selling intensifies.
* $239: Secondary PUT Wall, representing a key defense point.
* Volume Profile:
* Point of Control (POC): Near $245.69, confirming this as a high-volume price level and significant short-term support.
Trade Scenarios:
Bullish Scenario:
* Entry: Above $246.50 (gamma resistance breakout).
* Target: $250 and $257.70.
* Stop-Loss: Below $245.
Bearish Scenario:
* Entry: Below $244.
* Target: $242 and $239.
* Stop-Loss: Above $246.50.
Directional Bias:
* The overall trend remains bullish within the ascending channel on the daily timeframe. However, watch for a breakout above $246.50 for confirmation of further upside. A failure to hold above $245 could lead to a short-term pullback toward $241.
Disclaimer:
This analysis is for educational purposes only and should not be taken as financial advice. Please conduct your own research and manage risk appropriately.
A Case To Be Long GoldSince the beginning of the year, I've been seeking an opportunity to invest in gold, and I believe there's a compelling case from macroeconomic, fundamental, and technical perspectives.
Macroeconomic Perspective on Gold
With President Trump returning to office, it's important to consider the economic impact of his proposed income tax reductions. Lowering individual taxes increases disposable income, leading to higher consumer spending without incurring additional debt. This contrasts with lowering interest rates, which encourages spending through borrowing, potentially having a slower effect on inflation compared to direct fiscal measures like tax cuts.
The recent stimulus checks have shown a direct impact on inflation, and similar effects could arise from income tax cuts, especially for tipped workers. Investors often turn to gold as a store of value during inflationary periods, making it a potentially attractive investment under these conditions.
Fundamental Analysis of Gold
Currently, the price of gold relative to the SP:SPX ( $TVC:GOLD/SP:SPX ) appears undervalued. Additionally, the GOLD/SPX ratio is at a support level, indicating potential for appreciation.
Seasonal Trends
Historically, over the past 18 years, gold has shown strong performance from January to late February, posting negative returns only four times. Even in those instances, the losses were minimal compared to the gains during positive years, suggesting a favorable seasonal pattern for gold investments during this period.
Technical Analysis of Gold
Gold has been in an uptrend, and after a significant pullback, there appears to be an opportunity to enter the market. The recent large bearish movements may indicate a slowdown in the weekly trend, leading to a consolidation phase where the market establishes a new price range.
Conclusion
Gold presents a promising opportunity for inclusion in a long-term investment portfolio, potentially offering substantial returns. Monitoring the risk/reward profile is essential, and adjustments may be necessary based on market developments. If the desired entry point isn't reached and a bullish inside bar forms this week, next week's entry could be even more favorable.
Good luck and happy trading!
For more information on this subject and many others visit my website and my YouTube.

GLD UpdateStill waiting for price to continue lower towards the target box. As I have said many times before, C waves can either be 3 or 5-wave moves. This appears as if it will be a 3-wave move based on the structure it has carved out thus far. I am of a mindset that we should move into the box within the next month or two. Gold in general just moves very slow the majority of the time. Every once in a while, it sees some volatility but that is very rare.
Should it make a new ATH before entering the box, then wave 4 is likely already over and was very short. This is not my primary thought process but nonetheless it is very possible.

Gold vs. Silver: Is the Ratio Signaling a Major ShiftIntroduction:
Precious metals are displaying promising price action, warranting a closer look at the gold AMEX:GLD to silver AMEX:SLV ratio. This ratio provides valuable insights during bull markets:
Bullish Silver: In a strong bull market, silver typically outperforms gold, causing the ratio to decline.
Gold Leading: Recently, gold has taken the lead, advancing in a corrective rally, but there are signs this could change.
Analysis:
Inverted Saucer Formation: On the gold-to-silver ratio chart, a large inverted saucer formation is emerging. This bearish pattern indicates a potential breakdown below key support levels, signaling silver’s outperformance in the months ahead.
What to Watch:
A confirmed breakdown of support in this ratio could signal a major shift in favor of silver.
If silver outperforms, prices could surge to retest its 2011 highs of $48-$50 next year.
Gold Outlook: Despite the shift in favor of silver, gold remains bullish. A breakout could target significant upside, with price projections of $3,300-$3,400.
Trade Setup:
Silver Bullish Setup:
Trigger: A breakdown in the gold-to-silver ratio, confirming silver’s relative strength.
Target: SLV retesting $48-$50.
Stop Loss: Manage risk by placing stops near recent support levels in silver.
Gold Bullish Setup:
Gold continues to show strength, targeting $3,300-$3,400. Monitor for breakouts in gold prices alongside silver’s potential surge.
Conclusion:
The precious metals setup looks increasingly bullish. The gold-to-silver ratio is hinting at a shift toward silver outperformance, a hallmark of true bull markets. If this scenario plays out, silver could retest its 2011 highs, while gold targets new all-time highs. This is a chart and setup worth keeping a close eye on in the coming months. Which metal do you think will lead the charge? Share your thoughts below!
Charts:
(Include charts showing the gold-to-silver ratio with the inverted saucer formation, key support levels, and projected breakdown targets. Add gold and silver price charts highlighting bullish setups.)
Tags: #Gold #Silver #PreciousMetals #GLD #SLV #BullMarket #TechnicalAnalysis #TradingIdeas

$GLD Double Bottom, Bullish Inverted H&S AND Bull flagging?! Am I blind? Are you? Holy moly. This looks textbook under the reversal patterns I have documented. To be HONEST, it doesn't look 100% but it's showing signs. In my previous AMEX:GLD posts I said $242.73 needs to hold and it has. I think AMEX:GLD is creating a new floor of support for the next 3-6 months. I'm going to be entering GETTEX:250C for months out in 2025. + EOY rally. $250 target gets AMEX:GLD to a 30% YTD. AMEX:SPY in the same boat, 30% YTD - I posted a chart on it as well, check that out. Leave a comment to let me know your thoughts. I looked through many time frames and this one looks the best. I can't say I'm a fan of the big Elmo candles but I see a flag forming. Leave a follow and a comment.
wALL sTreeT L0S3R

$GLD boiling, $253.99 targéPosted a chart before, this seems to be setting up for a EOY pop. Flagging, spinning stop doji, tight one at least, on the green side. $250 calls for Jan-Feb. Bitcoin CRYPTOCAP:BTC vs. Gold Trust $GLD. Money is on both.
Wall street Loser


$GLD cup and handleFew weeks ago AMEX:GLD pulled back from its all time highs back into the $230s, hit $236 then went all the way back to $250 then back to $242. Here you can see a little cup and handle, if it stays above $245.17 I will enter monthly calls for a $250 strike. I entered $240c for 12/20 when it dipped the first time and made a 100% return and sold too early, wound up going 300%. I think AMEX:GLD has a lot more to run.

Market Update - 11/24/2024Small caps are taking the lead again, consumer discretionary, finance and energy names are the strongest. These are all healthy signs. Interestingly nuclear names ( NASDAQ:NNE , NYSE:SMR , MIL:NUCL ) are showing high relative strength. China names might also start working again next week after a nice consolidation for ~2 months. Over a third of my passive account is invested in energy/commodity ETFs which have been doing well, especially MIL:EXXY due to $GLD. There are also lots of good setups and my market timing model has been significantly improving in the last few days. I'm quite bullish, until the market proves me otherwise.
