$HVLO – 4H Chart Fibonacci ZoneOn the 4-hour chart, $HVLO tests the 50% Fibonacci level at $0.0016, with the 200-period MA nearby. RSI at 52 is neutral; MACD shows early bullish momentum.
A bounce targets $0.0019; below $0.0015 hits $0.0013.
Trading Plan: Buy at $0.0016, stop loss at $0.0015, take profit at $0.0019. Short below $

$HVLO – Daily Chart Ichimoku Setup$HVLO is below the Ichimoku Cloud on the daily chart, bearish, but the Tenkan-sen ($0.0016) crosses above the Kijun-sen ($0.0015). RSI at 50 is neutral.
Above $0.0017 targets $0.0020; below $0.0015 hits $0.0013.
Trading Plan: Buy at $0.0016, stop loss at $0.0014, take profit at $0.0020. Short below

$HVLO – 1H Chart Scalping Range$HVLO on the 1-hour chart ranges between $0.0015 and $0.0017. ADX below 20 signals a weak trend, ideal for scalping. RSI at 50 is neutral; price near the 100-period MA.
Buy at $0.0015, sell at $0.0017.
Trading Plan: Buy at $0.0015, stop loss at $0.0014, take profit at $0.0017. Short at $0.0017, stop

$HVLO – 4H Chart Bullish Wedge$HVLO on the 4-hour chart forms a falling wedge, a bullish pattern. Price nears $0.0015, with RSI at 45 showing divergence. The 50-period EMA at $0.0017 is resistance.
Above $0.0017 targets $0.0020; below $0.0014 hits $0.0012.
Trading Plan: Buy at $0.0016, stop loss at $0.0014, take profit at $0.002

$HVLO – Weekly Chart Support HoldThe weekly chart shows $HVLO holding $0.0014 support, with Stochastic RSI rising from oversold, hinting at reversal. The 20-week MA at $0.0018 is resistance. Volume spikes on dips suggest buying.
Above $0.0016 targets $0.0018; below $0.0014 aims for $0.0010.
Trading Plan: Buy at $0.0015, stop loss a

$HVLO – Daily Chart Resistance Test$HVLO rejected $0.0020 resistance on the daily chart, forming a bearish candle. Price tests the 50-day MA at $0.0016, with RSI at 48, showing weak momentum. OBV is flat, indicating no strong buying.
Below $0.0016 could hit $0.0014; above $0.0017 targets $0.0020.
Trading Plan: Short at $0.0016, stop

$HVLO – 1H Chart Momentum BuildOn the 1-hour chart, $HVLO bounced off $0.0014, crossing the 50-period MA. MACD shows a bullish crossover, and RSI at 60 suggests upside potential. Volume is rising, supporting the move. Resistance at $0.0017 looms.
Above $0.0017 could target $0.0020; below $0.0014 risks $0.0012.
Trading Plan: Buy a

$HVLO – 4H Chart Consolidation Range$HVLO on the 4-hour chart is trading between $0.0015 and $0.0018, forming a rectangle pattern. The 20-period EMA is flat, signaling no clear trend, while Bollinger Bands are tight, hinting at a volatility spike. RSI at 50 is neutral, with slight bullish divergence. Volume is steady but low.
A breako
$HVLO – Weekly Chart Bullish Reversal SetupOn the weekly chart, $HVLO is testing a key support zone at $0.0014, forming a potential inverse head-and-shoulders pattern, a classic bullish reversal signal. The left shoulder and head bottomed near $0.0013, with the right shoulder forming now. The neckline sits at $0.0022, and a break above could

$HVLO – Daily Chart Ascending Triangle FormationThe $HVLO token on the daily chart is forming an ascending triangle, a bullish pattern characterized by higher lows and a flat resistance at $0.0020. The price has respected support around $0.0015 multiple times, aligning with the 200-day moving average (MA), reinforcing its strength. The 50-day MA

See all ideas
Summarizing what the indicators are suggesting.
Oscillators
Neutral
SellBuy
Strong sellStrong buy
Strong sellSellNeutralBuyStrong buy
Oscillators
Neutral
SellBuy
Strong sellStrong buy
Strong sellSellNeutralBuyStrong buy
Summary
Neutral
SellBuy
Strong sellStrong buy
Strong sellSellNeutralBuyStrong buy
Summary
Neutral
SellBuy
Strong sellStrong buy
Strong sellSellNeutralBuyStrong buy
Summary
Neutral
SellBuy
Strong sellStrong buy
Strong sellSellNeutralBuyStrong buy
Moving Averages
Neutral
SellBuy
Strong sellStrong buy
Strong sellSellNeutralBuyStrong buy
Moving Averages
Neutral
SellBuy
Strong sellStrong buy
Strong sellSellNeutralBuyStrong buy
Related pairs
Frequently Asked Questions
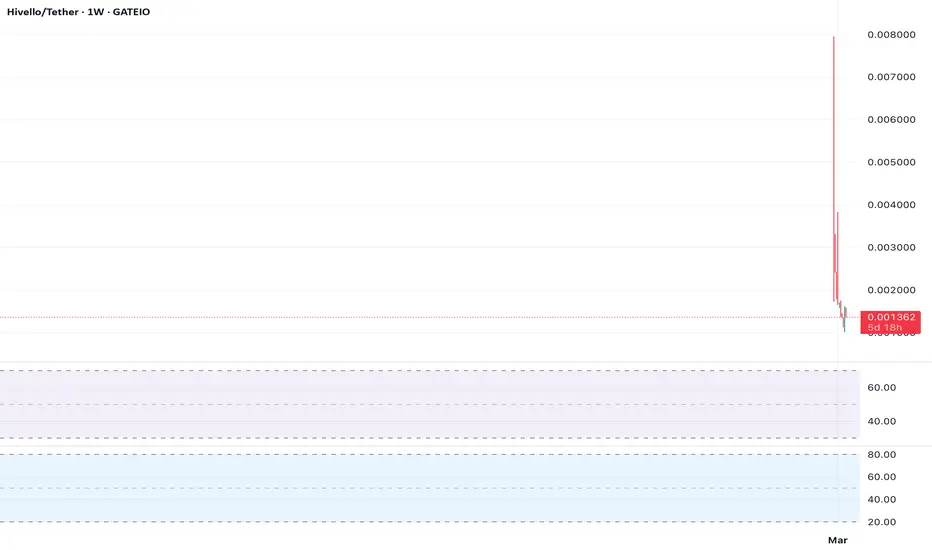
The current price of Hivello / USDT (HVLO) is 0.001094 USDT — it has fallen −0.45% in the past 24 hours. Try placing this info into the context by checking out what coins are also gaining and losing at the moment and seeing HVLO price chart.
Hivello / USDT price has fallen by −23.44% over the last week, its month performance shows a −22.19% decrease, and as for the last year, Hivello / USDT has decreased by −76.62%. See more dynamics on HVLO price chart.
Keep track of coins' changes with our Crypto Coins Heatmap.
Keep track of coins' changes with our Crypto Coins Heatmap.
Hivello / USDT (HVLO) reached its highest price on Feb 11, 2025 — it amounted to 0.009490 USDT. Find more insights on the HVLO price chart.
See the list of crypto gainers and choose what best fits your strategy.
See the list of crypto gainers and choose what best fits your strategy.
Hivello / USDT (HVLO) reached the lowest price of 0.001014 USDT on Apr 9, 2025. View more Hivello / USDT dynamics on the price chart.
See the list of crypto losers to find unexpected opportunities.
See the list of crypto losers to find unexpected opportunities.
The safest choice when buying HVLO is to go to a well-known crypto exchange. Some of the popular names are Binance, Coinbase, Kraken. But you'll have to find a reliable broker and create an account first. You can trade HVLO right from TradingView charts — just choose a broker and connect to your account.
Hivello / USDT (HVLO) is just as reliable as any other crypto asset — this corner of the world market is highly volatile. Today, for instance, Hivello / USDT is estimated as 0.64% volatile. The only thing it means is that you must prepare and examine all available information before making a decision. And if you're not sure about Hivello / USDT, you can find more inspiration in our curated watchlists.
You can discuss Hivello / USDT (HVLO) with other users in our public chats, Minds or in the comments to Ideas.