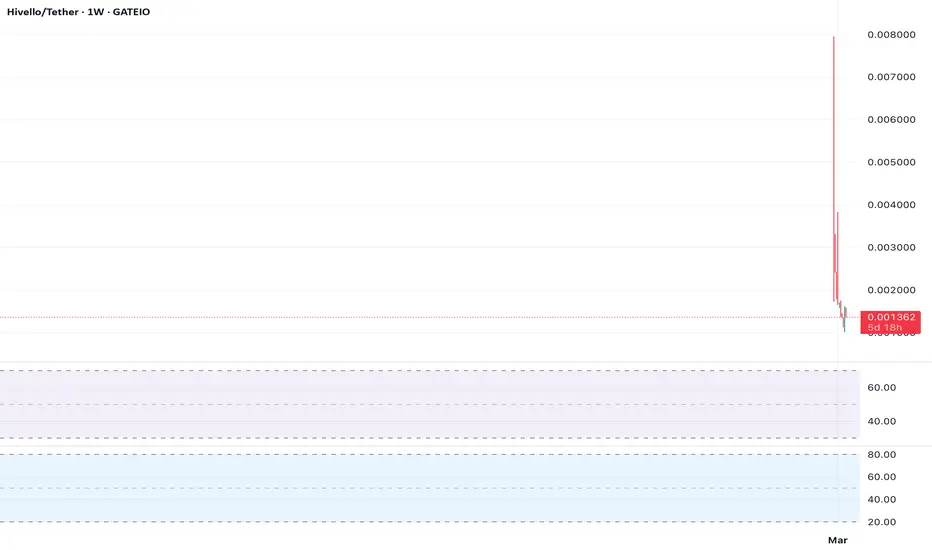
$HVLO – 4H Chart Fibonacci ZoneOn the 4-hour chart, $HVLO tests the 50% Fibonacci level at $0.0016, with the 200-period MA nearby. RSI at 52 is neutral; MACD shows early bullish momentum.
A bounce targets $0.0019; below $0.0015 hits $0.0013.
Trading Plan: Buy at $0.0016, stop loss at $0.0015, take profit at $0.0019. Short below $0.0015, targeting $0.0013. Confirm with volume.
HVLOUSDT trade ideas

$HVLO – Daily Chart Ichimoku Setup$HVLO is below the Ichimoku Cloud on the daily chart, bearish, but the Tenkan-sen ($0.0016) crosses above the Kijun-sen ($0.0015). RSI at 50 is neutral.
Above $0.0017 targets $0.0020; below $0.0015 hits $0.0013.
Trading Plan: Buy at $0.0016, stop loss at $0.0014, take profit at $0.0020. Short below $0.0015, targeting $0.0013. Watch cloud resistance.

$HVLO – 1H Chart Scalping Range$HVLO on the 1-hour chart ranges between $0.0015 and $0.0017. ADX below 20 signals a weak trend, ideal for scalping. RSI at 50 is neutral; price near the 100-period MA.
Buy at $0.0015, sell at $0.0017.
Trading Plan: Buy at $0.0015, stop loss at $0.0014, take profit at $0.0017. Short at $0.0017, stop loss at $0.0018, take profit at $0.0015.

$HVLO – 4H Chart Bullish Wedge$HVLO on the 4-hour chart forms a falling wedge, a bullish pattern. Price nears $0.0015, with RSI at 45 showing divergence. The 50-period EMA at $0.0017 is resistance.
Above $0.0017 targets $0.0020; below $0.0014 hits $0.0012.
Trading Plan: Buy at $0.0016, stop loss at $0.0014, take profit at $0.0020. Short below $0.0014, targeting $0.0012. Watch breakout breakout volume.

$HVLO – Weekly Chart Support HoldThe weekly chart shows $HVLO holding $0.0014 support, with Stochastic RSI rising from oversold, hinting at reversal. The 20-week MA at $0.0018 is resistance. Volume spikes on dips suggest buying.
Above $0.0016 targets $0.0018; below $0.0014 aims for $0.0010.
Trading Plan: Buy at $0.0015, stop loss at $0.0013, take profit at $0.0018. Short below $0.0014, targeting $0.0010. Confirm volume trends.

$HVLO – Daily Chart Resistance Test$HVLO rejected $0.0020 resistance on the daily chart, forming a bearish candle. Price tests the 50-day MA at $0.0016, with RSI at 48, showing weak momentum. OBV is flat, indicating no strong buying.
Below $0.0016 could hit $0.0014; above $0.0017 targets $0.0020.
Trading Plan: Short at $0.0016, stop loss at $0.0018, take profit at $0.0014. Buy above $0.0017, targeting $0.0020, stop at $0.0015. Check volume.

$HVLO – 1H Chart Momentum BuildOn the 1-hour chart, $HVLO bounced off $0.0014, crossing the 50-period MA. MACD shows a bullish crossover, and RSI at 60 suggests upside potential. Volume is rising, supporting the move. Resistance at $0.0017 looms.
Above $0.0017 could target $0.0020; below $0.0014 risks $0.0012.
Trading Plan: Buy at $0.0015, stop loss at $0.0013, take profit at $0.0020. Short below $0.0014, targeting $0.0012. Monitor RSI for overbought signals.

$HVLO – 4H Chart Consolidation Range$HVLO on the 4-hour chart is trading between $0.0015 and $0.0018, forming a rectangle pattern. The 20-period EMA is flat, signaling no clear trend, while Bollinger Bands are tight, hinting at a volatility spike. RSI at 50 is neutral, with slight bullish divergence. Volume is steady but low.
A breakout above $0.0018 could target $0.0021; below $0.0015 may hit $0.0013.
Trading Plan: Buy at $0.0016, stop loss at $0.0014, take profit at $0.0018–$0.0021. Short below $0.0015, targeting $0.0013. Watch volume for direction.
$HVLO – Weekly Chart Bullish Reversal SetupOn the weekly chart, $HVLO is testing a key support zone at $0.0014, forming a potential inverse head-and-shoulders pattern, a classic bullish reversal signal. The left shoulder and head bottomed near $0.0013, with the right shoulder forming now. The neckline sits at $0.0022, and a break above could confirm the pattern. The 50-week MA ($0.0020) acts as resistance, while the 200-week MA ($0.0012) supports the bullish case. The Stochastic RSI is rising from oversold levels (below 20), indicating fading selling pressure. However, the Awesome Oscillator shows weak momentum—bulls need green bars for confirmation.
Fibonacci retracement from the all-time high ($0.0055, Feb 2025) places the 50% level at $0.0033, a target if the pattern completes. Failure to hold $0.0014 could see $0.0010 tested (all-time low zone). Volume is low but rising on dips, suggesting accumulation. Hivello’s staking incentives could drive demand, per recent updates.
Trading Plan:
Buy Zone: $0.0015–$0.0016 (near support).
Stop Loss: $0.0013.
Take Profit: $0.0022, $0.0033.
Bearish Scenario: Short below $0.0014, targeting $0.0010.
A weekly close above $0.0022 validates the bullish thesis. Monitor DePIN sector performance, as $HVLO’s low market cap ($949K) makes it sensitive to news. Risk management is key—set stops to protect against sudden dumps. Cross-check with broader market trends before trading.

$HVLO – Daily Chart Ascending Triangle FormationThe $HVLO token on the daily chart is forming an ascending triangle, a bullish pattern characterized by higher lows and a flat resistance at $0.0020. The price has respected support around $0.0015 multiple times, aligning with the 200-day moving average (MA), reinforcing its strength. The 50-day MA is trending upward, approaching a potential golden cross over the 200-day MA, which could signal strong bullish momentum. The Relative Strength Index (RSI) at 55 indicates room for upside without being overbought, while the MACD shows a tightening histogram, suggesting an imminent crossover.
Volume has been consistent, with spikes on support tests, hinting at accumulation. A breakout above $0.0020 could target $0.0028 (38% gain), based on the triangle’s height projected from the breakout point. Conversely, a drop below $0.0015 may test $0.0012, a prior low. DePIN sector sentiment and Hivello’s project updates could influence direction, so monitor news.
Trading Plan:
Buy Zone: $0.0016–$0.0017 (near support).
Stop Loss: $0.0014.
Take Profit: $0.0020, $0.0028.
Bearish Scenario: Short below $0.0015, targeting $0.0012.
Traders should watch Bitcoin’s movement, as altcoins like $HVLO often follow. A surge in Solana ecosystem activity could also boost $HVLO. Use tight risk management—low liquidity in newer tokens can lead to sharp volatility. Confirm breakouts with volume and check TradingView community sentiment for additional context.
