ID is bearish for the mid-term (2D)Before anything, pay attention to the timeframe—it's a 2-day timeframe, so it will take time.
Given that a large-degree bearish triangle has completed, this coin may remain bearish in the mid-term. The red zone is where the next major bearish wave could start.
A daily candle closing above the invalidation level will invalidate this analysis.
For risk management, please don't forget stop loss and capital management
Comment if you have any questions
Thank You
IDUSDT trade ideas

ID/USDTKey Level Zone: 0.20300 - 0.20500
HMT v8.1 detected. The setup looks promising, supported by a previous upward/downward trend with increasing volume and momentum, presenting an excellent reward-to-risk opportunity.
HMT (High Momentum Trending):
HMT is based on trend, momentum, volume, and market structure across multiple timeframes. It highlights setups with strong potential for upward movement and higher rewards.
Whenever I spot a signal for my own trading, I’ll share it. Please note that conducting a comprehensive analysis on a single timeframe chart can be quite challenging and sometimes confusing. I appreciate your understanding of the effort involved.
Important Note :
Role of Key Levels:
- These zones are critical for analyzing price trends. If the key level zone holds, the price may continue trending in the expected direction. However, momentum may increase or decrease based on subsequent patterns.
- Breakouts: If the key level zone breaks, it signals a stop-out. For reversal traders, this presents an opportunity to consider switching direction, as the price often retests these zones, which may act as strong support-turned-resistance (or vice versa).
My Trading Rules
Risk Management
- Maximum risk per trade: 2.5%.
- Leverage: 5x.
Exit Strategy
Profit-Taking:
- Sell at least 70% on the 3rd wave up (LTF Wave 5).
- Typically, sell 50% during a high-volume spike.
- Adjust stop-loss to breakeven once the trade achieves a 1.5:1 reward-to-risk ratio.
- If the market shows signs of losing momentum or divergence, ill will exit at breakeven.
The market is highly dynamic and constantly changing. HMT signals and target profit (TP) levels are based on the current price and movement, but market conditions can shift instantly, so it is crucial to remain adaptable and follow the market's movement.
If you find this signal/analysis meaningful, kindly like and share it.
Thank you for your support~
Sharing this with love!
HMT v2.0:
- Major update to the Momentum indicator
- Reduced false signals from inaccurate momentum detection
- New screener with improved accuracy and fewer signals
HMT v3.0:
- Added liquidity factor to enhance trend continuation
- Improved potential for momentum-based plays
- Increased winning probability by reducing entries during peaks
HMT v3.1:
- Enhanced entry confirmation for improved reward-to-risk ratios
HMT v4.0:
- Incorporated buying and selling pressure in lower timeframes to enhance the probability of trending moves while optimizing entry timing and scaling
HMT v4.1:
- Enhanced take-profit (TP) target by incorporating market structure analysis
HMT v5 :
Date: 23/01/2025
- Refined wave analysis for trending conditions
- Incorporated lower timeframe (LTF) momentum to strengthen trend reliability
- Re-aligned and re-balanced entry conditions for improved accuracy
HMT v6 :
Date : 15/02/2025
- Integrated strong accumulation activity into in-depth wave analysis
HMT v7 :
Date : 20/03/2025
- Refined wave analysis along with accumulation and market sentiment
HMT v8 :
Date : 16/04/2025
- Fully restructured strategy logic
HMT v8.1 :
Date : 18/04/2025
- Refined Take Profit (TP) logic to be more conservative for improved win consistency

#ID/USDT#ID
The price is moving in a descending channel on the 1-hour frame and is expected to continue upwards
We have a trend to stabilize above the moving average 100 again
We have a descending trend on the RSI indicator that supports the rise by breaking it upwards
We have a support area at the lower limit of the channel at a price of 0.2516
Entry price 0.2720
First target 0.2810
Second target 0.2895
Third target 0.3068

IDUSDT 5DID ~ 5D Analysis
#ID Buy gradually from here with a minimum target of 20%+
The reason, this is the lowest support for now.

#ID/USDT#ID
The price is moving in a descending channel on the 1-hour frame and is adhering to it well and is heading to break it upwards strongly and retest it
We have a bounce from the lower limit of the descending channel, this support is at a price of 0.3000
We have a downtrend on the RSI indicator that is about to break and retest, which supports the rise
We have a trend to stabilize above the moving average 100
Entry price 0.3322
First target 0.3156
Second target 0.3237
Third target 0.3322

IDUSDT 12H#ID is moving inside a falling wedge pattern on the 12H chart. It recently broke above the 12H MA50 and the pattern resistance with high volume but faced rejection at the top of the Ichimoku cloud. It remains very bullish—buy and hold. Targets are:
🎯 $0.4079
🎯 $0.4608
🎯 $0.5136
🎯 $0.5890
🎯 $0.6849

IDUSDT 120%-140% Gains – Bullish Momentum Confirmed!IDUSDT has successfully broken out of a Falling Wedge Pattern, signaling the potential for a substantial upward move. The Falling Wedge is a bullish continuation pattern, often seen during downtrends, where the price consolidates within converging trendlines before breaking out. With the breakout now confirmed, the market is showing strong signs of a bullish reversal. The volume accompanying this breakout is good, indicating solid investor participation and confirming that there’s significant buying pressure behind this move. Traders are now anticipating potential gains of 120% to 140%+ as the price targets higher levels.
The breakout from the Falling Wedge Pattern marks a key turning point for IDUSDT, as it signals that the price is likely to accelerate after breaking through the upper trendline. The good volume further validates the strength of this move, as higher volume during a breakout is often a precursor to continued upward momentum. With the market clearly showing signs of bullish sentiment, the next major resistance levels will be critical in determining how far IDUSDT can go in the coming days or weeks. If the price continues to maintain its bullish trajectory, the expected gains of 120% to 140%+ could be reached quickly.
Investor interest in IDUSDT is increasing, as more traders recognize the potential of this pattern and the breakout that has already taken place. The Falling Wedge often leads to explosive moves once the price clears key resistance levels, and IDUSDT is well-positioned to make such a move. The combination of a well-formed technical setup, strong volume, and growing investor interest is making IDUSDT an exciting project to watch. As the price gains momentum, it could quickly rise, offering significant profits for those who have entered at the right time.
Traders should continue to monitor support and resistance levels closely, as these will be key indicators of whether the breakout can hold and sustain its bullish momentum. The overall crypto market sentiment will also play a role in IDUSDT’s movements, but given the strong technical setup and volume, this pair looks poised for impressive gains. As always, careful timing and strategic entry points will be crucial to maximizing profits from this promising setup.

IDUSDT 3DID ~ 3D Analysis
#ID In the 3D time frame, this is a very good support for now, Buy from here if you still have a Conviction on this coin with a minimum target of 20%+

#ID 1D GREAT FOR LONG TIMEPotential upside in the next 2-3 months is possible, guess what, good luck

Can #ID Bulls Really Continue this Bullish Momentum? Key LevelsYello, Paradisers! Will #IDUSDT rally to new highs or face a sharp rejection? Let’s dive into the current setup of #SpaceID:
💎#ID recently broke out of a well-defined descending channel—a structure often signaling a shift in trend. Currently, the price is consolidating near the $0.423 support zone, a critical level to watch for the next move. For bulls to regain momentum, the price must decisively break above the $0.5773 resistance zone. This will confirm the breakout and open the door for a significant rally.
💎If #IDUSD successfully reclaims the $0.577 resistance level, the next key hurdle lies in the major resistance zone around $0.750. A breakout above this level would likely trigger a strong upward move, potentially targeting even higher levels. Watch for increased trading volume and strong bullish candles above $0.577 as confirmation of market strength.
💎On the downside, if the price fails to hold above the $0.423 support zone, a retest of the demand zone near $0.366 becomes highly probable. This area has historically attracted buyers, but if it fails to hold, the bullish setup will be invalidated.
💎A daily close below $0.366 could lead to further downside pressure, with potential targets near $0.3000 or lower. So, let's see how this #ID setup turns out, but the probability of it going up is higher.
Stay focused, patient, and disciplined, Paradisers🥂
MyCryptoParadise
iFeel the success🌴

ID is bullish#ID has some of the finest patterns the market made a good rise after hitting the past demand zone and also made a good correction which hit the fibo 0.62 level and also VWAP

ID looks bullish (2D)The larger pattern of the ID symbol appears to be a significant diametric, with ID now aiming to enter wave E.
Wave E is bullish.
If the price holds within the green zone, it can move toward the targets.
The targets are marked on the chart.
Closing a daily candle below the invalidation level will invalidate this analysis.
For risk management, please don't forget stop loss and capital management
When we reach the first target, save some profit and then change the stop to entry
Comment if you have any questions
Thank You

Will #ID Explode or Collapse? Watch These Critical Levels Yello, Paradisers! Are we standing on the edge of a major breakout or will #IDUSDT plunge into a deeper retracement? Let’s break down the latest analysis of #SpaceID:
💎#ID has been trading within a broadening wedge pattern for months, with descending resistance and support lines shaping the structure. Recently, the price broke out above the wedge’s descending resistance—a critical technical milestone. However, for any meaningful upside, the price must conquer the $0.7495 resistance level, which currently stands as the major hurdle.
💎A clean breakout above $0.7495, confirmed with a daily close, could unleash a significant bullish rally. The next targets on this trajectory would be around $1.00 and potentially higher toward the $1.30–$1.60 major resistance zone. These levels would likely draw in fresh buying momentum, propelling the price further upward.
💎On the flip side, the $0.6710 level serves as immediate support. Below that, there is a strong demand zone at $0.5218–$0.3955, which has acted as a springboard for bullish recoveries in the past. As long as the price remains above this demand zone, the bullish case remains intact. A dip into this zone could provide an ideal opportunity for bulls to regain control.
💎However, if #IDUSD closes a candle below $0.3955, this would invalidate the bullish structure. Such a move could signal further downside, with the price targeting lows around $0.2850 or even lower. This scenario would shake out inexperienced traders and open opportunities for short sellers.
Stay focused, patient, and disciplined, Paradisers🥂
MyCryptoParadise
iFeel the success🌴

IDUSDT: Bullish Breakout or Panic-Inducing Breakdown?Yello, Paradisers! Are you ready for a major move on IDUSDT? If you’ve been keeping an eye on this one, you might be in for a game-changer!
💎IDUSDT is approaching the resistance trendline, forming a classic Cup & Handle pattern—and we’ve got a bullish divergence in play.
💎If IDUSDT breaks and closes a candle above the resistance zone, it will confirm the Cup & Handle pattern, significantly increasing the odds of a bullish reversal. This could be your signal to ride the wave up!
💎Now, if we get a pullback, don’t panic. We’re eyeing a bounce off the support zone. But for a safer bet and higher probability in our favor, we need to see a bullish I-CHoCH in lower timeframes for confirmation.
💎On the flip side, if the price breaks down and closes candle below the support zone, that’s a red flag. It will invalidate our bullish scenario altogether.
Be patient, wait for the right confirmation, and avoid emotional decisions. Smart trading is about following the strategy and never rushing the market. Stay sharp and disciplined, Paradisers! 💪
MyCryptoParadise
iFeel the success🌴

ID/USDT TECHNICAL ANALYSISCoin: ID/USDT
Chart Timeframe: 1 Day
If you are planning to buy ID/USDT, three conditions out of five should be available.
1-) ROBO: AI Buy✅
2-) Cloud: GREEN ✅
3-) Smart Money (Whale Tracking): IN✅
4-) Downtrend Line Breakout has been confirmed: ✅
5-) AI Social Intelligence Score: GREEN 5 ✅
5/5 Perfect: ✅
We bought ID/USDT at 0.42.
Entry Strategy:
➡️ Buy with after the three positive confirmations.
Take Profit Levels:
➡️ When your money doubles, don't forget to sell half of it.
➡️ Take partial profits at AI Take Profit signals and resistance levels.
Stop Loss:
➡️ Wait until the three negative confirmations appear to exit.
Wishing you profitable trades!
________________________________________
The investment information, comments, and recommendations provided here are not within the scope of investment advisory services. Investment advisory services are provided within the framework of an investment advisory agreement to be signed between intermediary institutions, portfolio management companies, non-deposit banks, and the customer. The comments and recommendations presented here are based on the personal opinions of those providing the comments and recommendations. These opinions may not be suitable for your financial situation, risk tolerance, and return preferences. Therefore, making investment decisions based solely on the information provided here may not yield results in line with your expectations.

ID broke o⚫️ #ID broke out of the accumulation at the bottom of Huge Ascending Channel and ready to flip the middle resistance🔥
Last chance to enter BME:ID before we get sent🚀
Targets are intact👌
🎯1 Target - 1.3985$
🎯2 Target - 3.3900$

ID - boxThe price will break through the consolidation (box) in the near future, growth targets are marked on the chart

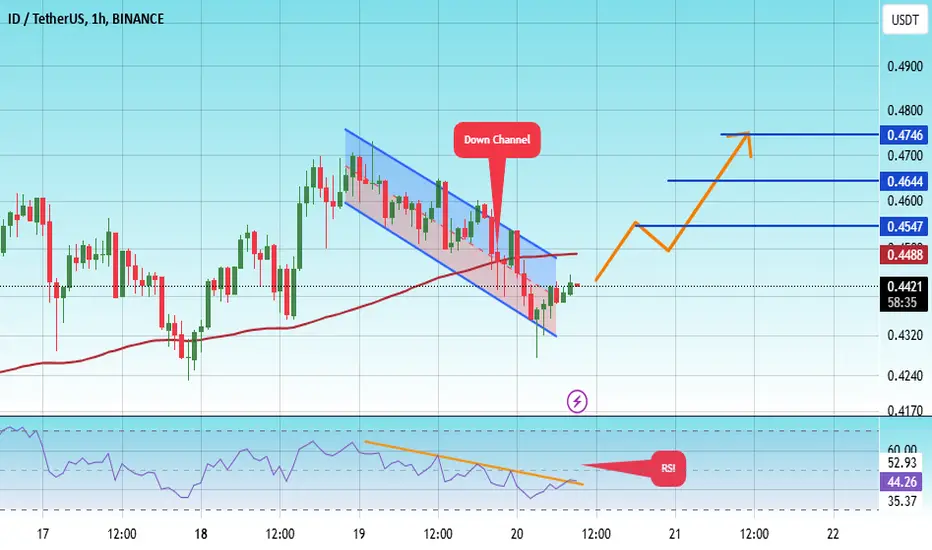
#ID/USDT Ready to go up#ID
The price is moving in a descending channel on the 1-hour frame and sticking to it well
We have a bounce from the lower limit of the descending channel, this support is at 0.4320
We have a downtrend, the RSI indicator is about to break, which supports the rise
We have a trend to stabilize above the moving average 100
Entry price 0.4428
First target 0.4547
Second target 0.4644
Third target 0.4746
SPACE ID (ID)SPACE ID is all in one domain manager for web3. It is a newly started project and there are not enough candles to see the big picture. Anyway, there is a downtrend channel in which price is descending. If this channel breaks upward, there is a possibility of an impulse wave. Let's see what happens.

IDUSDTID ~ 5D
#ID Make gradual purchases on this support block. With a short term target of at least 20%++. We think this is a strong enough support block to hold the price.

IDUSDT LONG IDEAhi all, as you see on charti id broke its descending structure. also considering btcdom's huge pump yesterday, we can expect thta altcoing gonna pump a bit in 2 3 days. so we can short setup,
entry :0.3874
stop : 0.3674
target : 0.44

IDUSDTID ~ 5D
#ID If you have Conviction on this coin,. Make gradual purchases on these support blocks. with a short term target of at least 20%++

#ID (SPOT) entry range (0.3020- 0.4020) T.(1.4990) SL(0.2850)BINANCE:IDUSDT
entry range (0.3020- 0.4020)
Target1 (0.5510) - Target2 (0.7230)- Target3 (0.9999)- Target4 (1.1840)- Target5 (1.4990)
SL .1D close below (0.2850)
*** collect the coin slowly in the entry range ***
*** No FOMO - No Rush , it is a long journey ***
**** #Manta ,#OMNI, #DYM, #AI, #IO, #XAI , #ACE #NFP #RAD #WLD #ORDI #BLUR #SUI #Voxel #AEVO #VITE #APE #RDNT #FLUX #NMR #VANRY #TRB #HBAR #DGB #XEC #ERN #ALT #IO #ACA #HIVE #ASTR #ARDR #PIXEL #LTO #AERGO #SCRT #ATA #HOOK #FLOW #KSM #HFT #MINA #DATA #SC #JOE #RDNT #IQ #CFX #BICO #CTSI #KMD #FXS #DEGO #FORTH # AST #PORTAL #CYBER #CLV #RIF ENJ #ZIL #APT #MAV #ZRX #ID ****
