US100We can attempt to buy US100 from specified level as it make HL , also there is no bearish divergence occur indicate that it moves upward.
SL , TP mention in chart.
NASDAQ.USD.1.IEN trade ideas

NAS100 BUY ANALYSIS POIHere on Nas100 price has made a be drop showing the seller stepping the market and has also forming a break of structure at down side but the buyers are likely to step in around area of 20114.78 support so trader should wait for price to touch around that zone before going to buy and target profit of about 21247.62 . Use money management

NASDAQ - Reversal ExpectedAttention, traders!
In the current sell-off we have very high values in the PCQ (put-call ratio on the NASDAQ)!
The stocks are trading above the highs that initiated a bullish reversal in August 2024, for example.
The following chart shows two potential targets for a long trade.

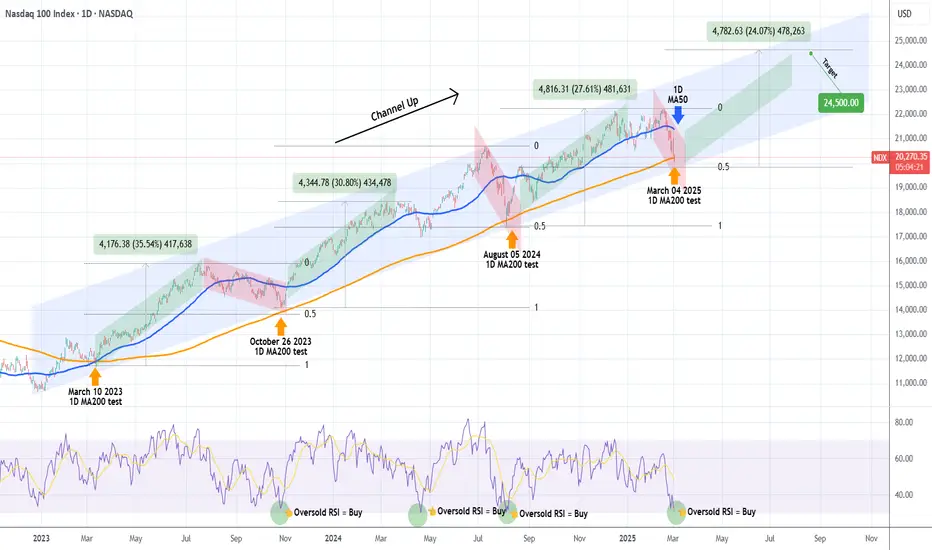
NASDAQ hit its 1D MA200. Strongest buy signal in 2 years!Nasdaq (NDX) hit today its 1D MA200 (orange trend-line) for the first time in 7 months (since the August 05 2024 Low) with its 1D RSI almost oversold (below 30.00). In the past 2 years (since the March 10 2023 test), the 1D MA200 has been tested another 3 times, all of which have been the absolute technical buy entries, kick-starting enormous rallies.
On top of that, the price is close to the bottom (Higher Lows trend-line) of the long-term Channel Up that started on the December 2022 market bottom. Every rally that followed after a 1D MA200 test has been marginally weaker than the previous but all three have been around +30% on average. The last one has been +27.61%, which is -3% weaker than the previous.
As a result, we are expecting a new rally to start now as all buy conditions within a 2-year span have been met (1D MA200, oversold 1D RSI) that can target 24500, which represents a +24.00% rally (-3% shorter rise than the previous).
-------------------------------------------------------------------------------
** Please LIKE 👍, FOLLOW ✅, SHARE 🙌 and COMMENT ✍ if you enjoy this idea! Also share your ideas and charts in the comments section below! This is best way to keep it relevant, support us, keep the content here free and allow the idea to reach as many people as possible. **
-------------------------------------------------------------------------------
💸💸💸💸💸💸
👇 👇 👇 👇 👇 👇
NASQ 100 - Has its revised pattern been created? Hello traders, please feel free to share your trading ideas, and please give a Boost if you agree with my trading plan. My trading strategy is Price Action, which is the simplest strategy of trading on the price movement. A key part of my discipline is Stop Loss set when opening a trading position, which ensures every trading is risk managed. My 1 to 1 trading training is available, please message. Trade well and good luck!

NAS & Indices are continuing to meltAll the indices are still seeking correction of inefficiencies existing in the sellside. There isn't much else to be said of this current situation until we start receiving bullish closes on higher time frame 4H/Daily.
Be sure to share this with a friend. I assure you this is trustworthy information and levels 🫡

BUY Trade for US100 15 Minute Time FrameBuy at Current Price: 20145
Stoploss: 20025
RP: 20265
R:R=1:1

POSITION REVERSED ON NASDAQWe reversed our position after that we got an IFVG to target the DLQ we have at 19785.48.

NASDAQ Potential DownsidesHey Traders, in today's trading session we are monitoring NAS100 for a selling opportunity around 20700 zone, NASDAQ is trading in a downtrend and currently is in a correction phase in which it is approaching the trend at 20700 support and resistance area.
Trade safe, Joe.

CHART BREAKDOWN NASDAQ: Key Levels, Targets and Thoughts!Brief Description🖊️:
The chart provides insights into critical market levels, emphasizing 1 essential supply zone: low-risk sell spanning from 20,470.00 to 20,510.00, respectively, is highlighted.
Things I Have Seen👀:
Important Demand Zone🟢: Identified between 20,470.00 and 20,510.00 serving as a low-risk sell.
Bearish Targets📉:
20,430.00: Possible retracement area.
20,370.00: Possible retracement area.
20,300.00: Possible retracement area.
20,200.00: Possible retracement area.
20,120.00: Possible retracement area.
19,900.00 : Liquidity area.
What's Important Now❗
Currently, the crucial approach is to wait and observe the price action at this level. We need to assess how the market reacts before considering any decisive moves. Stay observant and responsive to real-time developments in the market.

NASQ 100Hello traders, please feel free to share your trading ideas, and please give a Boost if you agree with my trading plan. My trading strategy is Price Action, which is the simplest strategy of trading on the price movement. A key part of my discipline is Stop Loss set when opening a trading position, which ensures every trading is risk managed. My 1 to 1 trading training is available, please message. Trade well and good luck!

NDX close to a tradable low?NDX has now pulled back roughly 10% in the space of the last couple of weeks and has hit the rising 200 daily MA. Also looks like a wave 4. We could be close to a tradable low.

BUY NASDAQI'm sharing with you our trade this morning on NASDAQ which is based on the FVG after the LQ grab, to target the BUYSIDE LIQUIDITY.
Follow for more!

Long US100, NAS100, NASDQ, NQ - Swing PositionLong, it will hit tp in 1 week, great risk to reward trade, swing trade.
Please Note: I have BE the other trade I have open on this, I want to close it on BE and keep this position running for long.
Use proper risk management
Looks like good trade.
Lets monitor.
Use proper risk management.
Disclaimer: only idea, not advice

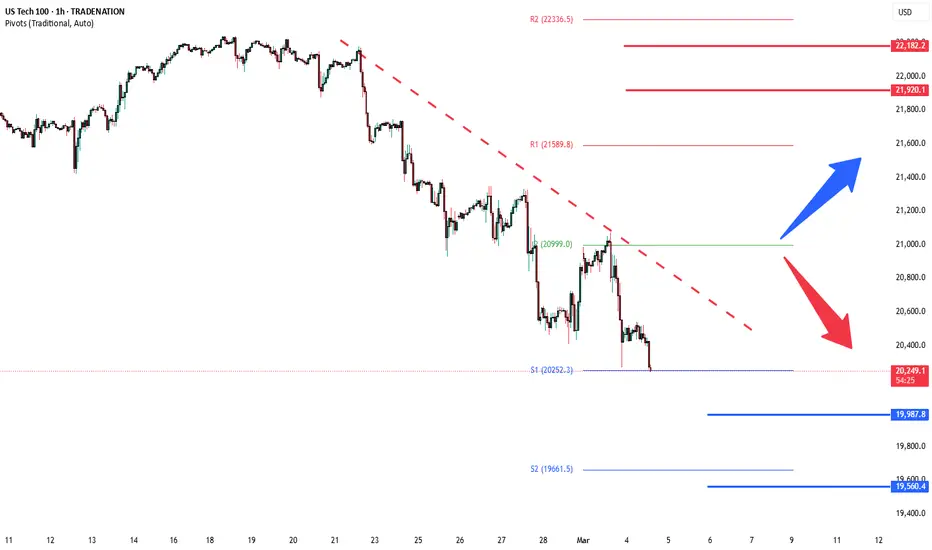
NSDQ China & Canada trigger “tariffs retaliations selloff”The tech-heavy NASDAQ dropped yesterday, underperforming the market, while the Mag-7 fell 3.09%, now down over 10% in the past two weeks. Nvidia led the decline, plunging 8.69%. The Nasdaq 100 (USTec) index maintains a long term bullish outlook supported by its long-term uptrend. However, recent price action suggests a corrective pullback following the all-time high, bringing the index to a key technical support zone.
Bullish Scenario:
The 20280 level (200-day moving average) serves as a critical support zone, aligning with the long-term rising trendline.
A pullback towards this level, followed by a bullish bounce, could reaffirm the prevailing uptrend.
Upside targets include:
21200 (key resistance)
21450 (50-day moving average)
21620 (20-day moving average)
A strong rebound from 20280 could reinforce bullish momentum and set the stage for further gains.
Bearish Scenario:
A confirmed breakdown below 20280 with a daily close beneath this level would weaken the bullish structure.
This could trigger a deeper retracement, leading to downside targets at:
19990 (next key support)
19560, if bearish pressure intensifies
A sustained loss of 20280 may indicate a broader correction, potentially shifting sentiment in favor of sellers.
Market Outlook:
The 20280 level is pivotal—holding above this support will sustain the bullish trend, while a decisive break below it could signal extended downside risks. Traders should monitor price action and volume at this critical level to gauge the market’s next move.
This communication is for informational purposes only and should not be viewed as any form of recommendation as to a particular course of action or as investment advice. It is not intended as an offer or solicitation for the purchase or sale of any financial instrument or as an official confirmation of any transaction. Opinions, estimates and assumptions expressed herein are made as of the date of this communication and are subject to change without notice. This communication has been prepared based upon information, including market prices, data and other information, believed to be reliable; however, Trade Nation does not warrant its completeness or accuracy. All market prices and market data contained in or attached to this communication are indicative and subject to change without notice.
NASDAQ SELLS Bearish Breakout (Most Probable): The price breaks down from the ascending triangle. This could involve:
Rejection at 20,486.0 followed by a break below the lower trendline of the ascending triangle.
Direct break below the lower trendline without significantly testing 20,486.0 again.
This would signal a continuation of the downtrend established by the bearish BOS.
Continued Consolidation (Less Probable, but Possible): The price might continue to trade within the ascending triangle for a bit longer. However, even in this case, the underlying bearish pressure would still favor a bearish resolution eventually.
Unexpected Bullish Breakout (Least Probable): While less probable given the bearish BOS, an unexpected bullish breakout above 20,486.0 is always possible in markets. However, for this to happen, there would need to be a significant shift in market sentiment and buying pressure to overcome the established bearish momentum. This would be considered a lower probability scenario given the current chart context.
