GOLD short-term analysis todayTechnically, the daily chart, four-hour chart, and hourly chart of gold maintain a volatile downward bearish structure. At present, the daily MA10/7-day moving average opens downward at the high level of 3060, and the MA5-day moving average opens downward and moves down to 3017. The RSI indicator runs below the 50 value of the middle axis.
The price of the short-term four-hour chart is below the MA10-day moving average, and the price keeps running in the middle and lower track of the Bollinger Band channel. Gold keeps volatile downward, and the trading idea remains unchanged, mainly selling at high rebounds. Resistance 3020/3036, support 2968/2956.
The recent market fluctuations are very large, which is also in line with the characteristics of gold. When all assets are sold, the safe-haven property of the currency is highlighted. The sharp drop is accompanied by a fierce rebound, and the amplitude is not small. This is the case on Thursday, Friday and today. The current market fluctuates by tens of dollars every day. It is an opportunity but also a big risk. If the panic sentiment does not subside, this will be the norm. What retail investors can do is to believe in the power of the trend and do a good job of risk control. The current market situation is defined as a volatile market, so you need to find the right entry point. Today, the resistance of gold is to sell in the pressure area of 3020-30.
Key points:
First support: 2968, second support: 2956, third support: 2942
First resistance: 3005, second resistance: 3020, third resistance: 3030
Operation ideas:
Buy: 2953-2956, SL: 2945, TP: 2970-2980;
Sell: 3014-3016, SL: 3024, TP: 2990-2980;
USCGC trade ideas

GOLD.. only single area, holds or not ??#GOLD... Now we have only single area that is around 3154
So keep close and if market hold it in that case we can expect further bounce to upside ..
Good luck
Trade wisely

Gold trend next week 4/7 - 4/11/2025🔔🔔🔔 Gold news:
➡️ Gold (XAU) continued to decline on Friday, hitting a seven-day low of $3,015 before recovering slightly following a speech by Federal Reserve (Fed) Chair Jerome Powell, who warned that inflation could reaccelerate due to tariffs. XAU/USD is trading at $3,037, down 2.70%.
➡️ Financial markets remain volatile as the trade war between the United States and China intensifies. Additionally, Powell dampened expectations of Fed easing, stating that tariffs could impact the U.S. economy by slowing growth and pushing inflation higher.
Personal opinion:
➡️ XAU/USD is under pressure from Powell's hawkish tone. But there are also concerns that Trump's retaliatory tariffs could dampen global economic growth and trigger a U.S. recession. Therefore, it would be prudent to wait for a sharp sell-off before confirming that XAU/USD has topped and positioning for a deeper corrective decline.
➡️ Look at the Strong Technical Zones to Get the Best Profit for You
Resistance Zone: 3075 – 3108 - 3133
Support Zone: 3000 - 2953 - 3060
FM wishes you a successful trading Week 💰💰💰

Gold Prices Decline, Short Strategy Successfully Captures ProfitCurrently, gold prices are showing a clear bearish trend, previously fluctuating around $3240. Based on market predictions, there is a potential for further downward movement in gold. A short position was suggested around the $3240 level, and as the market corrected, gold prices have indeed dropped, allowing short-positioned investors to lock in profits. Congratulations to those who successfully capitalized on this short opportunity and secured gains. Stay alert to market developments and carefully adjust your stop-profit levels to ensure the stability of your returns.

"Gold on Fire: Demand Zone Bounce with Bullish Target Ahead! "Key Zones & Levels:
Demand Zone 🔵
Area: 3099.36 – 3110
This is where buyers stepped in strongly before – price bounced up from here twice!
Strong support zone!
Resistance / Mini Consolidation ⚠️
Around 3125 – 3135
Price is hesitating here – needs to break this box for continuation.
Target Point 🎯
Level: 3168.17
Based on previous highs – this is the bullish target zone!
Stop Loss ❌
Level: 3099.36
Placed just below the demand zone to limit losses if price breaks down.
Trade Idea Summary:
Entry Zone: ✍️ 3110–3125
Stop Loss: ❌ 3099.36
Target: 🎯 3168.17
Risk-Reward Ratio: 5:1 ⭐️ (Great setup!)
What to Watch For:
✅ If price holds above demand and breaks the mini consolidation, expect bullish continuation.
❌ If price drops below the demand zone, setup is invalid – risk of further decline.

Partial fall warning due to proximity to the ceilingIt remains to be seen whether there are sufficient incentives for gold to continue growing given the price ceiling?
Can Trump smooth out the growth conditions by creating economic margins, or will all these margins become repetitive and ineffective? Do you think the tariff war, which is the main fuel for economic insecurity and gold growth, will become ineffective over time?
Gold continues to rise today - waiting for FOMC🔔🔔🔔 Gold news:
➡️ Gold prices remain confined to a range near multi-week lows reached on Monday amid mixed fundamental signals. The ongoing global trade war and growing fears of an economic recession have triggered a prolonged sell-off in stock markets worldwide. Additionally, rising expectations of more aggressive interest rate cuts by the Fed and a weaker US dollar have provided some support for bullion.
➡️ The global focus continues to revolve around US President Donald Trump’s trade war, and the recent calm appears to be only temporary. Market turbulence is expected to resume in the coming days as major economies are likely to announce countermeasures.
Personal opinion:
➡️ Gold still maintains its limited upward momentum today and awaits upcoming FOMC news. Potential uncertainties are still the main driving force for gold prices
➡️ Analysis based on resistance - support levels and pivot points combined with EMA and trend lines to come up with a suitable strategy
Resistance zone: 2978 - 2957
Support zone: 3033- 3056 - 3073
Plan:
🔆Price Zone Setup:
👉Sell Gold 3032- 3034 (Scalping)
❌SL: 3038 | ✅TP: 3028 - 3024 - 3020
👉Sell Gold 3058- 3056
❌SL: 3063| ✅TP: 3051 – 3046 – 3041
👉Buy Gold 2956- 2958
❌SL: 2950 | ✅TP: 2963 – 2968 – 2973
FM wishes you a successful trading day 💰💰💰

XAUUSD signal fomc Gold preserves its bullish momentum and trades near $3,050 in the second half of the day. Further escalation in the trade conflict between the US and China force markets to remain risk-averse midweek, allowing the precious metal to capitalize on safe-haven flows.
XAUUSD signal 3082
Support 3068
Support 3047
Support 3020
Resistance 3109
From a technical perspective, the recent sharp decline from the record high stalled near the 61.8% Fibonacci retracement level of the February-April move-up. The said support is pegged near the $2,957-2,956 area, or a multi-week low touched on Monday and is closely followed by the 50-day SMA, currently around the $2,952 region. A convincing break below the latter will be seen as a fresh trigger for bearish traders and drag the Gold price to the next relevant support near the $2,920 horizontal zone en route to the $2,900 round figure.

Latest market trend analysisThe current trend of gold is complex, affected by multiple factors. The radical tariff policy has made many countries concerned about trade retaliation, which highlights the strong position of the United States as an important buyer market in the world, and has also caused market uncertainty to a certain extent. After the sharp drop on Thursday and Friday last week, the intraday fluctuation of gold reached $100 on Monday, the lowest point fell to $2,954, and the cumulative decline from the high of $3,167 was more than $200.
Gold is currently in the fourth trading day of decline and adjustment. Although there was a rebound in the morning, the 1-hour moving average is still in a downward short position arrangement, and the short volume has not decreased, indicating that the short-term short trend is still continuing. Gold prices are also trying to recover lost ground after falling, but the rebound is weak. The bottom signal has not been confirmed yet. At present, given the obvious short trend, Xu Gucheng recommends rebounding shorts as the main strategy and callback longs as the auxiliary strategy, and pay close attention to the upper resistance of 3025-3030 and the lower support of 2956-2950.
Operation strategy 1: It is recommended to go short at 3025-3030 on the rebound, stop loss at 3040, and the target is 3000-2970. If it breaks, it will be 2050.
Operation strategy 2: It is recommended to go long at 3000-2994 on the pullback, stop loss at 2988, and the target is 3020-3030.

Gold: Buy setup brewing around 3045 – wait for confirmation!Hey traders! 👋
I’m eyeing a potential long opportunity on Gold in the 3030–3045 zone, but only with proper confirmation.
The shiny metal has broken and closed above Monday’s high with strong momentum, signaling short-term strength. However, considering the overall short-term bearish bias, I anticipate a pullback toward the 78.6% Fibonacci retracement level.
💡 Here's the plan:
🔸 Wait for price to dip into 3030–3045
🔸 Watch for bullish rejection candles or confirmation patterns
🔸 If confirmed, go long with targets at 3088 and 3123
🎯 This could be a great opportunity to catch the next leg up while still respecting short-term corrections.
If this setup adds value to your analysis, I’d truly appreciate your boost. Thanks for the continued support and happy trading! 💛📈

gold may Reverse from this resistancegold may Reverse from this resistance, a short position may be taken

Is the deep downward correction trend over?🔔🔔🔔 Gold news:
➡️ Major stock indexes plunged on Monday as U.S. President Donald Trump showed no signs of backing down from his sweeping tariff plans, prompting investors to bet that rising recession risks might force the Federal Reserve to cut interest rates as early as May.
➡️ Futures markets quickly priced in nearly five quarter-point rate cuts by the Fed this year, sending Treasury yields sharply lower and weakening the U.S. dollar despite its safe-haven appeal.
➡️ The market selloff intensified after Trump reporters told that investors would have to "take their medicine" and that he would not sign a trade deal with China until the U.S. trade deficit is addressed.
Personal opinion:
➡️ The trade war is taking place without mercy between the sides. This will be the driving force to make gold prices increase back to their main trend. And it seems that the deep correction has ended
➡️ Analysis based on important resistance - support and Fibonacci levels combined with trend lines and EMA to come up with a suitable strategy
Resistance zone: 3056 - 3076
Support zone: 3016 -2979
Plan:
🔆Price Zone Setup:
👉Sell Gold 3077 -3075
❌SL: 3083 | ✅TP: 3070 – 3085 – 3080
👉Buy Gold 3013 -3015
❌SL: 3008 | ✅TP: 3020 – 3025 – 3040
FM wishes you a successful trading day 💰💰💰

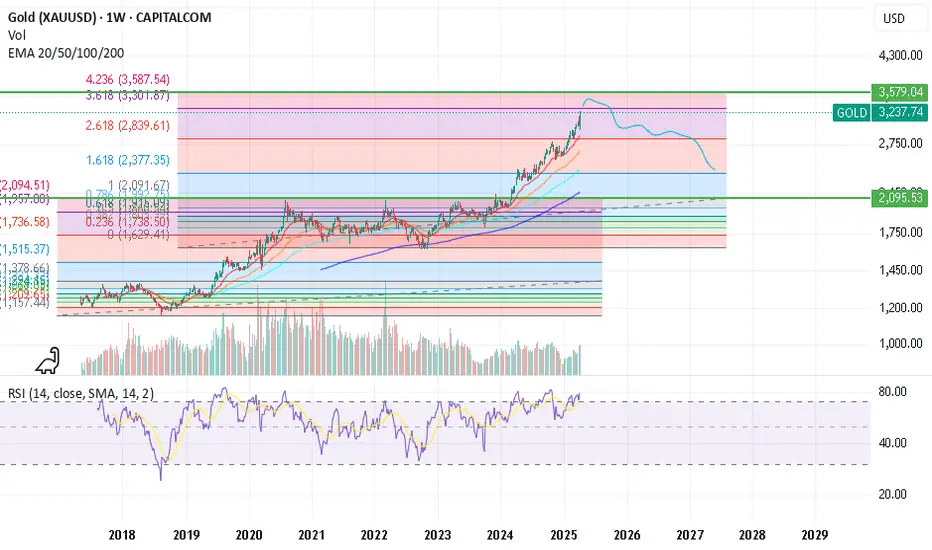
Analysis of gold trend:(2080-3050)Analysis of gold trend:(2080-3050)
In the early Asian session on Monday (April 7), spot gold continued to fall, once losing the 3000 integer mark, and refreshed the low since March 13 to 2976.97.
Affected by the rising concerns about international trade, US stock index futures continued to fall sharply, and the stock markets of Japan, Australia and New Zealand also followed the decline. Investors continue to sell gold to make up for the losses caused by the plunge in the market.
The current geopolitical situation is still in a state of easing or uncertainty, and the negative or positive effects on gold prices will be limited; Trump’s tariff policy has been fully implemented, and the positive factors have weakened; in addition, the Federal Reserve still said that it is not in a hurry to cut interest rates, which also weakened the bullish momentum of gold prices.
From a technical perspective:
The decline in gold did not continue. The market digested it after the opening, and there is room for a substantial increase. The current highest is 3055, an increase of 85 US dollars across the board.
This wave of decline may stop at the current 2970, and the rise can still see the previous high of 3150. Therefore, in this week's gold trading, the bullish trend is maintained, with 3150 as the target.
4-hour cycle:
After a low rebound, today's bottoming performance has also appeared, and the next wave can be seen at 3100-3150.
Today's strategy: Find key support points to go long:
Key support: 2970-2980
Current support: 3010-3015
Current resistance: 3055-3060
Key resistance: 3100-3150
Try to go long at a low price.
Note: At present, the volatility is severe, and the difficulty of conventional 5-10 point stop loss transactions has increased significantly, and the position ratio should be reasonably controlled.

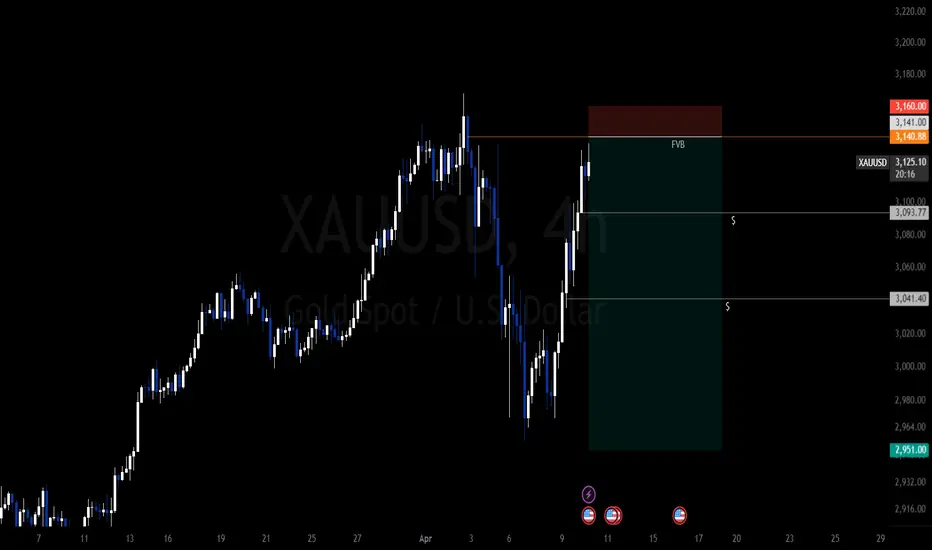
XAUUSD 4H | Premium Zone Rejection + FVG PlayGold tapped into a clear Fair Value Gap (FVG) around the $3,141–$3,157 zone—right at a premium level.
I’ve entered a short position at $3,141, anticipating a move down toward internal liquidity and sell-side targets.
Entry: $3,141
TP1: $3,094
TP2: $3,041
Final TP: $2,951
SL: $3,160
This setup is based on Smart Money Concepts:
• FVG reaction
• Premium pricing
• Liquidity engineering
• Bearish displacement
Let’s see if the algorithm delivers!
What’s your bias on gold this week?
Drop your thoughts and follow for more clean setups!
GOLD This 1-hour chart of Gold (XAU/USD) presents a detailed technical outlook showing a bullish breakout from a downtrend, followed by a strong rally, and a potential upcoming retracement.
Key highlights from the chart:
- The price previously broke out from a descending trendline, confirmed by the breakout above the 3,132.939 resistance level, followed by a continuation of the uptrend.
- The chart shows multiple FVGs (Fair Value Gaps) and support/resistance zones, which have been respected throughout the price movement.
- After bottoming out around 2,974.936, Gold began a bullish rally, forming higher highs and breaking past the 3,067.613 and 3,139.363 levels.
- The recent high around 3,220 marks a resistance zone, where price has currently stalled and is showing …
The volume profile shows a strong increase during bullish movements, indicating strong buyer interest. Traders will be watching the 3,168–3,150 zone closely—if it holds as support, it may offer a fresh opportunity for long positions toward a retest of 3,220 or higher. However, a break below this zone could signal a deeper correction.
Summary:
- Trend: Bullish
- Current Action: Pullback from resistance
- Watch Support: 3,168.521
- Potential Setup: Buy on pullback if support holds, otherwise wait for confirmation before re-entry.

XAU QUICK SHORT TRADE LIVE TRADE AND EDUCATIONAL BREAKDOWN Gold price (XAU/USD) touches a fresh weekly top, around the $3,132-3,133 area heading into the European session as concerns about escalating US-China trade tensions continue to drive safe-haven flows. Moreover, fears that tariffs would hinder economic growth and boost inflation turn out to be another factor that benefits the precious metal's status as a hedge against rising prices. Apart from this, bets for multiple interest rate cuts by the Federal Reserve (Fed) push the non-yielding higher for the second successive day.

XAUUSD: 7/4 Today's Market Analysis and StrategyGold technical analysis
Daily chart resistance 3080, support below 2950
Four-hour chart resistance 3050, support below 2970
One-hour chart resistance 3035, support below 3010.
The global stock market crash has triggered a large amount of funds to sell gold to cover stock market positions, but the central bank's demand for gold purchases (such as China's increase in gold holdings in March) provides long-term support. If the panic in the stock market eases and funds flow back to the gold market, it may push the gold price to rebound to $3050-3070. If the DXY index rises or the US stock market is sold more violently, the gold price may fall to the support band of $2950-2970.
Technical short-term bearish but need to guard against rebounds after oversold, pay close attention to US stock market fluctuations and geopolitical events, if panic escalates, it may trigger a simultaneous decline in gold and the stock market
Sell: 3040 SL: 3045
Sell: 2980 SL: 2985

Will Gold Shine Again Once The Tariff Storm Is Settled?Macro:
- Gold prices have fallen since Trump's 'Liberation Day' tariff announcement, as global stock market pressure and hedge fund margin calls forced asset liquidations, including gold.
- Despite the short-term drop, gold remains a key medium-term hedge against recession risks and ongoing uncertainty once markets stabilize.
- High volatility may persist until tariff disputes are resolved and central banks clarify potential support measures.
Technical:
- XAUUSD fluctuates within the range of 2957-3055. The price is between both EMAs, indicating an intact sideways structure.
- If XAUUSD breaks below the support at 2957, the price may retest the following support at 2880.
- On the contrary, breaking above 3055 may lead to a record-high retest at around 3135.
Analysis by: Dat Tong, Senior Financial Markets Strategist at Exness

Gold - Short setup in playGold is under pressure.
During yesterday's session, it broke through the psychological level of 3000.
A pullback to the 3030–3050 area is possible, but overall, I expect further downside.
The general approach is to trade from the short side.

XAUUSD Potential rise There is an upward impulse wave and a correction pattern. Another upward impulse wave is expected.

After the gold frenzy, there will soon be a sharp correctionTo be honest, I must admit that I still hold a short position. I think there should be many people holding short positions now, but they are unwilling to admit that they hold short positions because they are losing money.
I think it is not shameful to hold a short position now. Although gold has violently risen to around 3220, from the perspective of trading volume, gold is rising without volume. Without the support of trading volume, gold is destined to usher in a round of correction in the short term.
And I have reason to believe that the accelerated rise of gold is suspected of being manipulated by large institutional funds. There are two purposes. One is to accelerate the rise to attract more retail funds to flow into the market to take over; the other is to raise prices arbitrarily to make it easier to sell. So the faster gold rises, the easier it is to collapse! We first aim at the retracement target: 3150-3130 area,or even 3120.
So for short-term trading, I think we can still continue to short gold, and I am optimistic about the short position of gold! The trading strategy verification accuracy rate is more than 90%; one step ahead, exclusive access to trading strategies and real-time trading settings

XAUUSD SELL
Price Targets:
* Target 1: 3,140.000 (immediate resistance level – weak high).
* Target 2: Trail stops dynamically based on subsequent bullish momentum. Look for extensions to 3,150.000+.
#Forecast:
* Immediate Bias: Short-term pullback possible, but overall bullish momentum favors upside continuation.
possible, but overall bullish momentum favors upside continuation.
* Momentum Shift: Breach below 3,100.000 invalidates immediate bullish outlook, reassess at 3,080.00.

