XAUUSD Analysis todayHello traders, this is a complete multiple timeframe analysis of this pair. We see could find significant trading opportunities as per analysis upon price action confirmation we may take this trade. Smash the like button if you find value in this analysis and drop a comment if you have any questions or let me know which pair to cover in my next analysis.
USCGC trade ideas

XAUUSD sell trade setupThis chart outlines a Gold (XAU/USD) sell trade setup, based on a bearish double top pattern. Here’s a breakdown of the idea:
Double Top Pattern:
The chart highlights "TOP 1" and "TOP 2" at the same resistance level, indicating potential price exhaustion.
This is a classic reversal pattern, often leading to bearish momentum after the second top fails to break higher.
Entry Zone 3230
The trade is triggered at the resistance level after the second top, shown with a red arrow.
The price is currently approaching or at this level, suggesting the trader is anticipating a rejection and a move down.
Stop Loss (Red Zone):3247
Placed above the resistance line and recent highs, protecting the trade in case price breaks out upward instead of reversing.
Take Profits:
TP1 (Take Profit 1): 2:1 Reward-to-Risk Ratio — a safer exit, targeting a moderate price decline.
TP2 (Take Profit 2): 3:1 Reward-to-Risk Ratio — targeting a deeper move, likely to a previous support level marked by a blue horizontal line.
Trade Logic:
Price action bias: Repeated failure to break resistance = bearish bias.
Structure: Lower highs and signs of weakening bullish momentum.
Risk management: Well-defined stop loss and clear reward targets, with a risk-to-reward ratio that favors the trade.

Gold on aggressive uptrend extension as expectedTechnical analysis: Gold seems to be recovering last week's Intra-day steep decline towards local Bottom in a rather semi-stable fashion with Hourly 4 chart already stepped in Bullish waters sessions ago. The main reason behind it was the strong decline on the DX (comfortably Trading below the #52-week Low's), which entered an Descending Channel and as I've mentioned these past few weeks on my remarks, has the strongest Short and Medium-term effect (positive) on Gold. Technically, there is only #1 session left before the symmetry of the Hourly 4 chart's cycle catches up as the sequence mimics the previous one. Subsequently, every decline since August #12 resulted as an Short-term relief rally which suddenly reversed in even more steeper decline (check August #22, August #29, September #1 and September #7). If fractal is yet to be repeated, I should expect Price-action to show stagnation and stall the uptrend, then kick-start aggressive takedown towards #3,200.80 benchmark configuration where I will be ready with my piercing Selling orders.
My position: I have announced that Gold is on undisputed Bullish trend and total Bullish domination as I've practically Bought every Bottom lately. My suggestion is to continue Buying the dips / every local Low's.

THE KOG REPORT - Update End of day update form us here at KOG:
Yesterday we shared the idea from Friday where we said we would stick with the plan as our trades we in and protected after being managed. We said, if we break below we'll wait lower again to target that region above 3050-55 which was achieved with that move we saw on the open, however, after the undercut low.
Today we've taken a long again into the resistance level and then the indi's went crazy for the short on the red boxes which we gladly obliged to. A fantastic start to the week with Excalibur hitting on the nose down to where we are now.
We now have resistance 2977-80 with support below 2945-50. We would like to see how we close, but a dip down overnight could give traders an opportunity to capture the long trade into the higher resistance.
As always, trade safe.
KOG

Let us wait together for gold to break 3200
In terms of operation, short selling is still the main strategy, and short selling is still maintained near 3235. It is expected that gold will continue to adjust in the future, and 3200 will most likely be broken today.
Today's detailed operation strategy
Gold will go long at 3185, defend at 3175, and target 3200-3220
Gold will go short at 3235, defend at 3245, and target 3210-3180
Hello traders, if you have better ideas and suggestions, welcome to leave a message below, I will be very happy

GOLD LIVE TRADE AND EDUCATIONAL BREAKDOWN 18K PROFITGold price retains its positive bias above $3,200 amid US-China trade war, bearish USD
Gold price regains positive traction as US tariff uncertainty continues to underpin safe-haven assets. Bets for aggressive Fed rate cuts in 2025 keep the USD depressed and also benefit the XAU/USD pair.

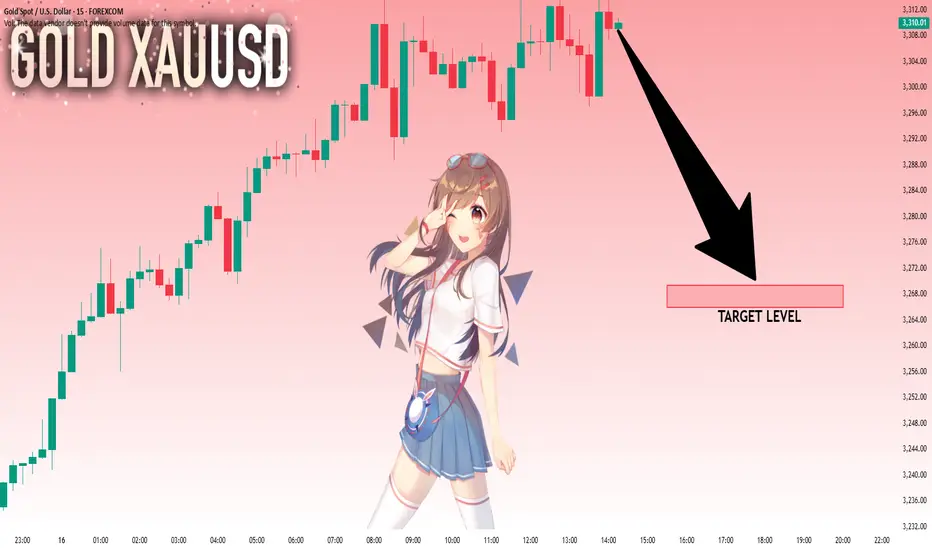
XAUUSD BUY TARGETYes guys this is the target for the market to open when the market opens it will jump from here 3240 is confirmed

Trading Signals for GOLD (XAU/USD) sell below $3,227 (+1/8 MurraMy GOLD (XAU/USD) sell trade setup looks like this.
Entry; 3215 @ 3219
Stop Loss: 3229
Target 1: 3168
Target 2: 3128
My Trade Analysis:
Early in the American session, gold is undergoing a strong technical correction after reaching a new high around 3,231-3,237 could occur, and the yellow metal could even surpass its high.
The strong volatility in gold suggests caution and lower risk when trading.
Technically, gold has not shown any technical correction so far.
Since the rebound on April 8th around 2,968, it has reached its current high around 3,237, indicating that a new bearish cycle could follow.
We could expect a strong technical correction toward the 8/8 Murray at 3,125 in the coming days. The metal could even reach the 21st SMA located at 3,089.
Technically, XAU/USD is overbought on the daily chart. A strong technical correction is highly probable in the coming hours or even next week. We could expect gold to return to 3,125 or even the psychological level of $3,000.
If gold breaks and consolidates above 3,235, we can expect it to continue rising to 3,245 (daily R_2) and eventually reach the strong resistance of the +2/8 Murray at 3,281, which could act as a barrier.

The gold surge is over, and it has started to adjust.The gold surge is over, and it has started to adjust. The gold price has basically reached the level I predicted in my last analysis. I think gold might adjust for a few years. This adjustment doesn’t necessarily mean a sharp drop; it’s more likely to be a consolidation phase. Meanwhile, silver will decline. The trigger could be a global recession caused by Trump.

GOLD: Will Go Down! Short!
My dear friends,
Today we will analyse GOLD together☺️
The in-trend continuation seems likely as the current long-term trend appears to be strong, and price is holding below a key level of 3,311.72 So a bearish continuation seems plausible, targeting the next low. We should enter on confirmation, and place a stop-loss beyond the recent swing level.
❤️Sending you lots of Love and Hugs❤️

A Weekly Summary of Gold: Continuously Breaking New Highs! This week, the gold market has been performing remarkably. It has continuously broken through all - time highs within just two days. Spot gold opened at $3088.17 per ounce, and its price has been oscillating upwards all the way, reaching a high of $3248 per ounce.
The gold market has witnessed a significant rally under the combined effect of various factors. Geopolitical risks have continued to provide a safe - haven support for gold. Factors such as the impact of tariff policies at the economic policy level have promoted the rise in gold prices from different perspectives. Market sentiment has also shifted from the previous panic selling to positive buying.
In the future, the economic data released by the United States and the policy expectations of the Federal Reserve will have an impact on the price of gold. The market's expectations for the Federal Reserve's interest rate cuts are constantly changing, and we need to keep a close eye on the relevant information.
If you approve of my analysis, you can give it a thumbs-up as support. If you have different opinions, you can leave your thoughts in the comments.Thank you!

Silver falling behind.By this measure, silver is falling behind now, as gold (vs cpi) is above its historical breakout line.
Silver has better chances of catching up AFTER stock markets bottom from an important bear market.

GOLD sell setup 15mHello! Friends,
Greetings. Please leave a Like if you like the idea.
Before start talking about technical Let's share your LOVE by giving me LIKES to support this work. Thanks in advance.

Gold Hits New Highs as US-China Tensions Escalate 📌 Gold Outlook: US-China Trade Tensions Fuel New Bullish Wave Amid Policy Uncertainty 🧨📈
🌍 Geopolitical Drivers Taking the Lead
On April 15th, President Donald Trump ordered an investigation into potential tariffs on all critical minerals imported into the U.S. – a move seen as the latest escalation in his ongoing economic confrontation with global trade partners, most notably China.
This development has shaken overall market sentiment, prompting investors to rotate into safe-haven assets like gold, which has surged in response.
At the same time, the U.S. Dollar weakened sharply, nearing 3-year lows last week, further increasing gold’s appeal for holders of other currencies.
🏦 Central Bank Uncertainty Adds Fuel to the Fire
Fed Chairman Jerome Powell stated that the central bank would not intervene to “rescue” markets during turbulent periods, suggesting that volatility may persist as hedge funds unwind leverage and global investors remain cautious.
He emphasized that the current volatility may be driven by shifting trade policies and broader uncertainty — which he said is “too early to fully diagnose.”
With central banks showing no immediate intent to inject liquidity or cut rates, the bullish case for gold remains strong in the coming weeks.
📊 Technical Outlook: New Highs in Sight, But Volatility Will Be Sharp
Gold continues to print new ATHs, and the dominant strategy right now is to trade with the trend — which clearly remains bullish. In such an environment, sudden drops are normal and not necessarily tied to any single news event.
Rather than attempting to short the market near highs, we are focusing on catching bullish continuation setups after sharp intraday corrections. These will likely form at support zones or classic continuation patterns on M15/M30 timeframes.
🔍 Price Levels to Watch
🟢 Support Zones:
3314 – 3300 – 3284 – 3266
🔴 Psychological Resistance:
3380 – 3396 – 3410
💼 Trade Plan
BUY ZONE:
Entry: 3300 – 3298
SL: 3264
TP Targets: 3304 → 3308 → 3312 → 3316 → 3320 → 3324 → 3330 → higher
SELL ZONE (Psychological Reaction Only):
Entry: 3396 – 3398
SL: 3402
TP Targets: 3392 → 3388 → 3384 → 3380 → 3376 → 3370
⚠️ Final Thoughts
We remain firmly buy-biased, especially as gold continues to be driven by macro and political catalysts. Pullbacks should be welcomed — not feared — and seen as opportunities to scale into longs at structure.
While intraday drops may appear sharp and sudden, they often lack fundamental backing and provide the best entry conditions for continuation traders. Be cautious with shorts — unless reacting to extended psychological resistance zones.
Always trade with a clear plan and never forget to honor your TP/SL levels to safeguard your capital.
💬 How are you navigating gold during this surge in global tension? Are you buying dips or waiting for a deeper correction? Let us know below! 👇👇👇

XAUUSD M15 I Bearish Drop Based on the M15 chart, the price could rise toward our sell entry level at 3342.30, a pullback resistance.
Our take profit is set at 3318.22, an overlap support that aligns close to the 38.2% Fibo retracement.
The stop loss is set at 3358.01, a swing high resistance.
High Risk Investment Warning
Trading Forex/CFDs on margin carries a high level of risk and may not be suitable for all investors. Leverage can work against you.
Stratos Markets Limited (tradu.com):
CFDs are complex instruments and come with a high risk of losing money rapidly due to leverage. 63% of retail investor accounts lose money when trading CFDs with this provider. You should consider whether you understand how CFDs work and whether you can afford to take the high risk of losing your money.
Stratos Europe Ltd (tradu.com):
CFDs are complex instruments and come with a high risk of losing money rapidly due to leverage. 63% of retail investor accounts lose money when trading CFDs with this provider. You should consider whether you understand how CFDs work and whether you can afford to take the high risk of losing your money.
Stratos Global LLC (tradu.com):
Losses can exceed deposits.
Please be advised that the information presented on TradingView is provided to Tradu (‘Company’, ‘we’) by a third-party provider (‘TFA Global Pte Ltd’). Please be reminded that you are solely responsible for the trading decisions on your account. There is a very high degree of risk involved in trading. Any information and/or content is intended entirely for research, educational and informational purposes only and does not constitute investment or consultation advice or investment strategy. The information is not tailored to the investment needs of any specific person and therefore does not involve a consideration of any of the investment objectives, financial situation or needs of any viewer that may receive it. Kindly also note that past performance is not a reliable indicator of future results. Actual results may differ materially from those anticipated in forward-looking or past performance statements. We assume no liability as to the accuracy or completeness of any of the information and/or content provided herein and the Company cannot be held responsible for any omission, mistake nor for any loss or damage including without limitation to any loss of profit which may arise from reliance on any information supplied by TFA Global Pte Ltd.
The speaker(s) is neither an employee, agent nor representative of Tradu and is therefore acting independently. The opinions given are their own, constitute general market commentary, and do not constitute the opinion or advice of Tradu or any form of personal or investment advice. Tradu neither endorses nor guarantees offerings of third-party speakers, nor is Tradu responsible for the content, veracity or opinions of third-party speakers, presenters or participants.

4.16 Gold safe-haven hits a new high. Go long on the trend durin4.16 Gold safe-haven hits a new high. Go long on the trend during the day!
The 4H cycle is strong, the Bollinger open state drives the moving average to turn upward, the triangle end shock has been broken, and the main trend during the day is to go long on the decline.
The support is maintained at 3250, and go long according to the decline strength.
The upper side looks at 3270, don't blindly guess the top!

Overbought territory Past historical data suggests that everytime gold has hit a new all time high with RSI overbought above 80 it does not sustain and a 10-20% pullback occurs.

XAUUSD M30 I Bearish Drop Based on the M30 chart analysis, we can see that the price has just reacted off our sell entry at 3223.18, which is an overlap resistance that aligns close to the 61.85 Fibo retracement.
Our take profit will be at 3190.47, a swing low support.
The stop loss will be placed at 3246.28, which is a swing high resistance level.
High Risk Investment Warning
Trading Forex/CFDs on margin carries a high level of risk and may not be suitable for all investors. Leverage can work against you.
Stratos Markets Limited (tradu.com):
CFDs are complex instruments and come with a high risk of losing money rapidly due to leverage. 63% of retail investor accounts lose money when trading CFDs with this provider. You should consider whether you understand how CFDs work and whether you can afford to take the high risk of losing your money.
Stratos Europe Ltd (tradu.com):
CFDs are complex instruments and come with a high risk of losing money rapidly due to leverage. 63% of retail investor accounts lose money when trading CFDs with this provider. You should consider whether you understand how CFDs work and whether you can afford to take the high risk of losing your money.
Stratos Global LLC (tradu.com):
Losses can exceed deposits.
Please be advised that the information presented on TradingView is provided to Tradu (‘Company’, ‘we’) by a third-party provider (‘TFA Global Pte Ltd’). Please be reminded that you are solely responsible for the trading decisions on your account. There is a very high degree of risk involved in trading. Any information and/or content is intended entirely for research, educational and informational purposes only and does not constitute investment or consultation advice or investment strategy. The information is not tailored to the investment needs of any specific person and therefore does not involve a consideration of any of the investment objectives, financial situation or needs of any viewer that may receive it. Kindly also note that past performance is not a reliable indicator of future results. Actual results may differ materially from those anticipated in forward-looking or past performance statements. We assume no liability as to the accuracy or completeness of any of the information and/or content provided herein and the Company cannot be held responsible for any omission, mistake nor for any loss or damage including without limitation to any loss of profit which may arise from reliance on any information supplied by TFA Global Pte Ltd.
The speaker(s) is neither an employee, agent nor representative of Tradu and is therefore acting independently. The opinions given are their own, constitute general market commentary, and do not constitute the opinion or advice of Tradu or any form of personal or investment advice. Tradu neither endorses nor guarantees offerings of third-party speakers, nor is Tradu responsible for the content, veracity or opinions of third-party speakers, presenters or participants.

Gold: Directional Break ImminentYesterday’s market remained calm without any significant swings, unlike the strong movements we’ve seen previously. Today, however, appears to be a critical turning point as the market prepares for a directional breakout.
📊 Technical Overview:
Gold is showing signs of retesting the resistance around 3240, while short-term support lies at 3194–3188. If this resistance holds and the price fails to break above, a double-top pattern may form—potentially triggering a major drop between Wednesday and Thursday.
If the price breaks above 3240, there may be around $30 of additional upside, but this is likely to mark the formation of a short-term top, followed again by a decline.
🎯 Key Bearish Target Zones: 3137-3106
Whether it breaks upward or downward, a bearish opportunity is building. Stay patient, follow the price action, and avoid emotional decisions to catch the move at the right moment.

.GOLD NEW D1 UPDATES NEW BEARISH SOON
. 🧠 **Gold Short Trade Idea** – Daily Chart
. 📌 **Market:** Gold (XAU/USD)
. 📆 **Timeframe:** Daily
. 🧭 **Bias:** Bearish (Short)
---
🔹 **Trade Setup**
🔸 Entry Zone:
- Sell Limit Order** around: **$3,250 – $3,274**
- This area shows recent rejection and may act as strong resistance.
🔸 Stop Loss:
- Above upper resistance:** Suggested around **$3,300**
- Gives breathing room in case of a false breakout.
🔸 Target Zone (Take Profit):
- TP1:** $3,145
- TP2 (Extended):** $3,122
- These are support zones based on prior structure.
---
📊 **Risk-Reward Ratio (RRR):**
- Entry:** ~$3,260 (mid of entry zone)
- Stop Loss:** ~$3,300 → Risk = 40
- Take Profit:** ~$3,145 → Reward = 115
- RRR:** **~2.87:1** (great setup)

XAUUSD H1 | Bullish ContinuationBased on the H1 chart analysis, the price is falling toward our buy entry level at 3168.03, a pullback support.
Our take profit is set at 3219.83, a pullback resistance.
The stop loss is placed at 3119.84, a pullback support.
High Risk Investment Warning
Trading Forex/CFDs on margin carries a high level of risk and may not be suitable for all investors. Leverage can work against you.
Stratos Markets Limited (tradu.com):
CFDs are complex instruments and come with a high risk of losing money rapidly due to leverage. 63% of retail investor accounts lose money when trading CFDs with this provider. You should consider whether you understand how CFDs work and whether you can afford to take the high risk of losing your money.
Stratos Europe Ltd (tradu.com):
CFDs are complex instruments and come with a high risk of losing money rapidly due to leverage. 63% of retail investor accounts lose money when trading CFDs with this provider. You should consider whether you understand how CFDs work and whether you can afford to take the high risk of losing your money.
Stratos Global LLC (tradu.com):
Losses can exceed deposits.
Please be advised that the information presented on TradingView is provided to Tradu (‘Company’, ‘we’) by a third-party provider (‘TFA Global Pte Ltd’). Please be reminded that you are solely responsible for the trading decisions on your account. There is a very high degree of risk involved in trading. Any information and/or content is intended entirely for research, educational and informational purposes only and does not constitute investment or consultation advice or investment strategy. The information is not tailored to the investment needs of any specific person and therefore does not involve a consideration of any of the investment objectives, financial situation or needs of any viewer that may receive it. Kindly also note that past performance is not a reliable indicator of future results. Actual results may differ materially from those anticipated in forward-looking or past performance statements. We assume no liability as to the accuracy or completeness of any of the information and/or content provided herein and the Company cannot be held responsible for any omission, mistake nor for any loss or damage including without limitation to any loss of profit which may arise from reliance on any information supplied by TFA Global Pte Ltd.
The speaker(s) is neither an employee, agent nor representative of Tradu and is therefore acting independently. The opinions given are their own, constitute general market commentary, and do not constitute the opinion or advice of Tradu or any form of personal or investment advice. Tradu neither endorses nor guarantees offerings of third-party speakers, nor is Tradu responsible for the content, veracity or opinions of third-party speakers, presenters or participants.

XAUUSD - LONG POSSIBILITYG old may react from the Weekly order block (W1 OB) and continue its bullish trend. The price is aggressively bullish, and there is a high chance of continuation of the trend.
