XAUUSD market structure analysis on 4H, DAY timeframeDAY Swing is bullish
4H swing is bearish => Current is pullback
There is a high probability that the price will continue to fall
We can look for a selling opportunity if on the 1H timeframe, M15 turns bearish
USCGC trade ideas

Gold Double TopXAUUSD will short from around 3125, observing this bearish flag pattern. Also, a double top is at play here. Have your stops around 3131 and hold.

XAUUSD Analysis TodayHello traders, this is a complete multiple timeframe analysis of this pair. We see could find significant trading opportunities as per analysis upon price action confirmation we may take this trade. Smash the like button if you find value in this analysis and drop a comment if you have any questions or let me know which pair to cover in my next analysis.

Gold (XAU/USD) Breakout Setup – Bullish Reversal from RBR Zone!🔹 Trade Idea: Long (Buy) Setup
📈 Targeting a price rally from a demand zone!
---
🔵 .ENTRY ZONE (Buy Area)
🟦 Marked between 3,039.773 – 3,043.052
📍 Located in the RBS + RBR zone (Resistance becomes Support + Rally-Base-Rally)
💡 Price dipped here and bounced — showing bullish intent
🔻 .STOP LOSS
🚨 Placed at 3,014.537
🛡️ Protects you in case the price drops below the zone
✋ Risk is clearly defined here
🎯 .TARGET POINT (Take Profit)
🚀 Aiming for 3,115.910
💸 A high reward area if momentum continues
🔥 Great R:R ratio (~1:3) — solid risk/reward
📊 .Technical Confirmation
📌 Price has moved above the 9-period DEMA (3,043.052)
⚡ Signals bullish momentum
🕯️ Strong bullish candles forming after the bounce — confirming entry.
🔍 .Market Structure Notes
⬇️ Previous trend was down
🔄 Now forming a potential reversal
🧱 Support holding strong near 3,014–3,030
✅ Summary: 💥 Buy idea from demand zone
🔝 Targeting new highs
🛑 Stop loss tightly managed
⚖️ Clean setup with momentum on your side

Gold Market prompts Short from 3040s to Mitigate Trend BreakoutGold market initiates a short move from the 3040s, aiming to mitigate the previous trend breakout around the 3017–3012 zone. This pullback sets the stage for a bullish countenance to potentially surface, aligning with the broader market sentimen fpollow for more insight , comment and boost idea.

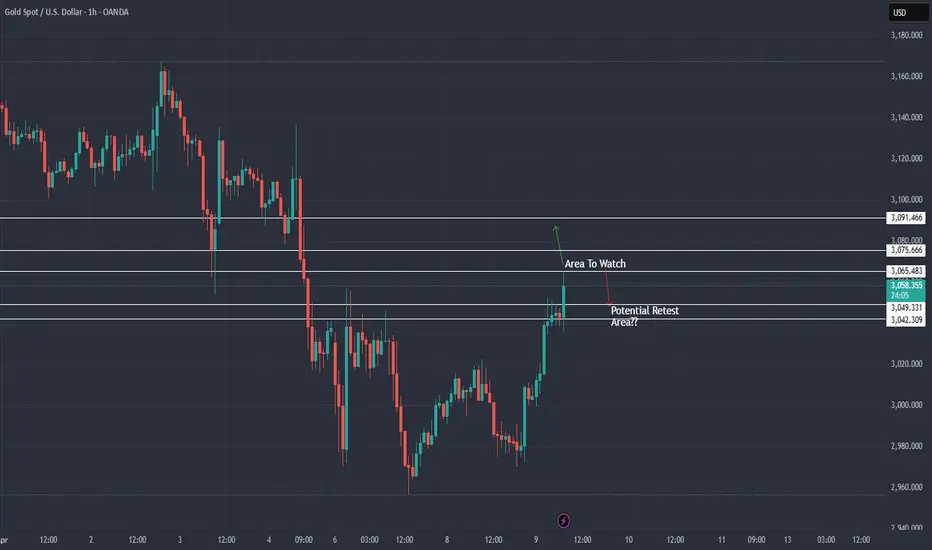
XAU / USD 1 Hour ChartHello traders. Taking a look at the hourly chart I have marked my area(s) of interest. If we pull back to the potential retest area, depending upon market conditions, I would look to see if support holds/ forms for a possible quick scalp up. This is just speculation and what I am looking at and not trading advice. Let's see how the Pre NY / NY volume does over the next hour or so. Big G gets a shout out. Be well and trade the trend. Happy Wednesday.
GoldXAUUSD
- Bullish Channel as an Corrective Pattern in Short Time Frame
- Break of Structure
- Demand Zone
- Completed " 12345 " Impulsive Waves and " AB " Corrective Waves
- Change of Characteristics

Gold (XAUUSD) AnalysisPrice is currently breaking above the key resistance zone around 3020, which has acted as a strong supply area in the past. A clean close above this level could open up bullish momentum towards the next target zone around 3030-3031.
However, failure to hold above 3020 could trigger a pullback or a potential sell-off back towards the 3002-2989 demand area.
Plan:
Potential Buys: Above 3020 closure confirmation
Potential Sells: Below 3002 closure confirmation
Watch price action closely around these levels for confirmation.

Gold Intraday Trading Plan 4/8/2025Gold has respected 3000 support yesterday and went up all the way to 3052 as expected. After that, it dropped all the way to 2957, breaking 3k support. Currently it is trading above 2960 support. In regard of current strong bearish momentum, goldy should continue to fall today, at least in Asia and Euro trading sessions.
I am looking to sell from 3000. 1st target is 2960. If it's broken, 2nd target will be 2930.

Gold Intraday Trading Plan 4/7/2025As explained in my weekly post, I am expecting gold to bounce from 2960-3000. In the opening of the week, it has already touched 2982.
I will be cautious in selling today as my 1st weekly target has been reached. As long as 3000 is held, I will buy towards 3052.

XAUUSD MARKET REVERSAL (BUY)During Friday’s NFP we saw heavy selling pressure on Gold. With Gold showing clear market structure breaking the previous higher low swing high, a sign of market reversal is in place creating a new higher high.
💡Scenario 1
Waiting for price to retest demand zone, and if it doesn’t break below we can aim to enter at this demand zone for buys. Targeting previous supply zones.
💡Scenario 2
If price breaks below the demand zone I will wait to see how price reacts at the previous demand zone for a better buy entry to the upside.
🧠CONCLUS
If all this is invalid then we will see a continuation to the downside. However, looking at this market structure and a trend reversal taking place creating higher higher and higher lows, it is a clear indication that price is reversing and becoming bullish. Wait for confirmation of candlesticks on 15min & 5min time frame, for either a bullish engulfing candlestick or, a shooting star.

Has the Gold Rally Come to an End?Gold has proven to be an exceptional hedge against the prevailing uncertainty in global markets, with much of this volatility driven by geopolitical tensions and policy unpredictability stemming from the influence of Donald Trump. Amid this backdrop, investors have increasingly sought safety in tangible assets, and gold has emerged as a preferred store of value.
Presently, GOLD has reached a significant technical milestone — the 1.618 Fibonacci extension level from the 2015 bear market low — after delivering a remarkable 100% appreciation over the past decade. This confluence of long-term Fibonacci projections and a sharp acceleration in price suggests that gold may be approaching a key inflection point.
Given the speed and magnitude of this recent rally, a period of consolidation or even a short-term pullback appears likely. Traders and long-term holders may begin to lock in profits, especially as valuations in gold become stretched relative to historical norms. The capital generated from this profit-taking could be rotated into other asset classes that are currently oversold or undervalued, potentially igniting a broader rebalancing across financial markets.
In this context, I see gold not only as a barometer of risk sentiment but also as a potential trigger for cross-asset shifts. Should profit-taking in gold accelerate, it could act as a catalyst for renewed interest in equities, commodities, or even emerging markets — areas that may offer more attractive risk-reward profiles at current levels. As such, I’ll be closely watching gold’s price action, not just in isolation, but for the signals it may send about broader market dynamics and capital flows.

Gold's Growth Sign - 11/04/2025The gold market remains highly active, supported by capital inflows seeking safe-haven assets amid escalating U.S.-China trade tensions following President Donald Trump's decision to increase tariffs on Chinese imports.
From a technical perspective, gold is in a strong uptrend. It is considered a hedge against instability, especially as the tariff war increases inflationary pressures and pushes bond yields higher. If the trade conflict persists, the U.S. dollar may lose its role in global trade, further supporting gold prices.

BULLISH SENTIMENTSNormally I have different expectations tailored for each trading sessions. When doing my backtesting, I usually study price action as per the sessions.
Currently I was anticipating buys for London session.
Price might continue with the trend during the NY but being a Friday, I wouldn't want to stay that long in this market.
If price doesn't take out the Asian BSL during this session then I won't wait to see what happens in New York session.
Safe trading guys and don't over do it.

XAUMO STRATEGY UPDATE — FRIDAY, APRIL 11, 2025XAUMO STRATEGY UPDATE — FRIDAY, APRIL 11, 2025
Breakout confirmed — bulls in full control. MM just swept above $3,200 — now entering overdrive.
We're in the middle of a classic institutional markup phase, triggered by breakout above $3,173 (previous Fib 50% zone). Price now pushing into high-volume inefficiency zone.
STRATEGY PLAN FOR THE DAY:
✅ PRIMARY TRADE SETUP — BUY THE DIP
Type: Buy Limit
Entry: $3,197
SL: $3,183
TP1: $3,215
TP2: $3,228
TP3: $3,261
Confidence: 88%
🧠 Justification: Pullback to Fib 78.6% support + rising trend, perfect for dip buy.
SECONDARY SETUP — MOMENTUM LONG (ONLY IF CLEAN PUSH ABOVE $3,215)
Type: Buy Stop
Entry: $3,216
SL: $3,202
TP1: $3,228
TP2: $3,261
TP3: $3,322
Confidence: 75%
🧠 Justification: Breakout above Fib 100% = next wave up.
//////======////////////======//////
TIMEFRAME SNAPSHOT
//////======////////////======//////
4H / 1D CHART:
RSI climbing above 70 = power move
Fib 100% target at $3,215.41 hit → watch for reaction
Next upside targets =
$3,228 → Fib 61.8% (Extended)
$3,261 → Fib 78.6%
$3,322 → Fib 100%
📌 Bias: Bullish with room to stretch. Profit-taking may kick in near $3,228–$3,261.
15M / 1H ANALYSIS:
Price: $3,205.73
ADX > 50, DI+ dominant = momentum alive
RSI in high 70s = strong, but approaching overbought
Volume increasing with price = healthy breakout
Upper Band of BB expanding → confirming expansion
Key Support Zones:
$3,197 → Fib 78.6%
$3,183 → Fib 61.8%
$3,173 → breakout base
📌 Bias: Bullish continuation unless price breaks back below $3,183.

Gold selling plan!- Completed " 12345 " Impulsive Waves
- Break of Structure
- RSI - Divergence
- FVG
- Fibonacci Level - 127.00%

Gold bulls are rising higherGold's 1-hour moving average continues to spread upwards and bulls are spreading. Gold bulls are full of strength. Gold still has upward momentum. The pullback will continue to give opportunities to go long.
Trading idea: Go long near gold 3175, stop loss 3165, target 3210
The above is only a sharing of trading ideas and does not constitute investment advice. You need to be responsible for your own profits and losses.

What is the stopping point for this strong Fomo buying?🔔🔔🔔 Gold news:
➡️ Gold prices hit an all-time high of $3,219 during Friday’s Asian session, supported by a weaker U.S. dollar and escalating trade tensions between the United States and China, which boosted demand for traditional safe-haven assets. Meanwhile, expectations of a more dovish Federal Reserve also contributed to the rally. Earlier U.S. economic data released the same day weighed on the greenback, as inflationary pressures eased more than anticipated in March, according to the Consumer Price Index figures.
Personal opinion:
➡️ Fomo selling pressure is too strong, and it is very risky to sell now. So waiting for prices to fall to technical levels and buying is the most reasonable decision
➡️ Note: update the latest information on tariffs and the US-China trade war. This is the focus in the coming time
➡️ Analysis based on important resistance - support and Fibonacci levels combined with trend lines to come up with a suitable strategy
Plan:
🔆 Price Zone Setup:
👉Buy Gold 3174- 3176 (Scalping)
❌SL: 3169 | ✅TP: 3180 – 3185– 3190
👉Buy Gold 3156- 3158
❌SL: 3150| ✅TP: 3163 – 3170 – 3180
👉Sell Gold 3235- 3237 (Scalping)
❌SL: 3243| ✅TP: 3230 – 3225 – 3220
👉Sell Gold 3255- 3257
❌SL: 3262| ✅TP: 3250 – 3245 – 3240
FM wishes you a successful trading day 💰💰💰

SELL SL: Above $3,226🚀 XAU/USD April 11, 2025 – Sniper Trading Flow
1. Is price at sniper zones?
• BUY: $3,210 – $3,213 ✅
• SELL: $3,218 – $3,222 ✅
2. Check Volume Delta:
• Positive Delta Spike = BUY bias.
• Negative Delta Reversal = SELL bias.
3. Candle Confirmation:
• BUY Setup:
Bullish engulfing / bullish CHoCH on 1M or 5M? ✅
• SELL Setup:
Bearish engulfing / bearish CHoCH after liquidity sweep? ✅
4. Quick Entry Rules:
• Enter immediately on confirmation candle close.
• BUY SL: Below $3,205.
• SELL SL: Above $3,226.
5. TP Management:
• TP1 = Hit +10 to +12 pips = partial close.
• TP2 = Hold for extension move.
• Adjust SL to breakeven after +10 pips.
⸻
Quick Mindset Flow:
See liquidity ➔ Wait trap ➔ Confirm candle ➔ Strike instantly.
No overthinking. No chasing. No mercy.

XAUUSD D1 | Bearish DropBased on the H4 chart analysis, we can see that the price is rising toward our sell entry at 3226.16, aligning with the 127.2% Fibo extension
Our take profit will be at 3170.13, a pullback support level.
The stop loss will be placed at 3307.54, above the 161.8% Fibonacci extension.
High Risk Investment Warning
Trading Forex/CFDs on margin carries a high level of risk and may not be suitable for all investors. Leverage can work against you.
Stratos Markets Limited (tradu.com):
CFDs are complex instruments and come with a high risk of losing money rapidly due to leverage. 63% of retail investor accounts lose money when trading CFDs with this provider. You should consider whether you understand how CFDs work and whether you can afford to take the high risk of losing your money.
Stratos Europe Ltd (tradu.com):
CFDs are complex instruments and come with a high risk of losing money rapidly due to leverage. 63% of retail investor accounts lose money when trading CFDs with this provider. You should consider whether you understand how CFDs work and whether you can afford to take the high risk of losing your money.
Stratos Global LLC (tradu.com):
Losses can exceed deposits.
Please be advised that the information presented on TradingView is provided to Tradu (‘Company’, ‘we’) by a third-party provider (‘TFA Global Pte Ltd’). Please be reminded that you are solely responsible for the trading decisions on your account. There is a very high degree of risk involved in trading. Any information and/or content is intended entirely for research, educational and informational purposes only and does not constitute investment or consultation advice or investment strategy. The information is not tailored to the investment needs of any specific person and therefore does not involve a consideration of any of the investment objectives, financial situation or needs of any viewer that may receive it. Kindly also note that past performance is not a reliable indicator of future results. Actual results may differ materially from those anticipated in forward-looking or past performance statements. We assume no liability as to the accuracy or completeness of any of the information and/or content provided herein and the Company cannot be held responsible for any omission, mistake nor for any loss or damage including without limitation to any loss of profit which may arise from reliance on any information supplied by TFA Global Pte Ltd.
The speaker(s) is neither an employee, agent nor representative of Tradu and is therefore acting independently. The opinions given are their own, constitute general market commentary, and do not constitute the opinion or advice of Tradu or any form of personal or investment advice. Tradu neither endorses nor guarantees offerings of third-party speakers, nor is Tradu responsible for the content, veracity or opinions of third-party speakers, presenters or participants.

XAUUSD ShortA Quick short trade Open: 3050//TP1: 2970//SL: 3170. Let's see how this trade rolls
Day20of100
L:5
W:5

XAUUSDXAUUSD is currently at a high point, with many expecting a declining in the near future. The market is showing signs that the recent strength in gold might not be sustainable, and a pullback could be on the horizon. Traders are anticipating potential shifts in sentiment that could lead to a downward movement, especially as attention turns to upcoming economic events and data.

