Gold in USD - 11th of April - go shortMeantime Gold did a spectacular upmove without any greater correction.
But meantime,,there we have a classical 1 to 5 price action.
Wave 3 completes plus minus 3%,,correction towards 2600 USD in next monthes.
USCGC trade ideas

XAUUSD buy setup trendline breakout H1 chart analysisXAUUSD GOLD Quick Trade Recap
Entry: 3004 (buy)
Targets:
TP1: 3040
TP2: 3115
TP3: 3163
This gives you a nice R-multiple especially if your stop is tight and placed wisely.
Suggestions & Checks
1. Trendline Break Confirmation
Did the candle close above the trendline?
Was it a strong body candle or a weak breakout (e.g., wick-heavy)?
Is it above a previous swing high or resistance?
2. Stop-Loss Placement
Under the breakout candle?
Below the trendline?
Below last higher low (safer but wider)?
3. Volume Spike
Did you check if volume increased during the breakout?
Weak volume = fakeout risk.
4. Confluence Factors
Any moving averages aligning?
Fibonacci levels lining up with your targets?
RSI divergence or MACD crossover?
5. Macro Watch
Upcoming US CPI/PPI or NFP?
Fed speakers, interest rate hints?
Geopolitical tensions?
Risk-to-Reward Example
Let’s say stop is at 2980:
TP1 (3040): R:R = ~1.38
TP2 (3115): R:R = ~4.63
TP3 (3163): R:R = ~6.63
Those are very favorable, especially if you scale out at each level.
Want help plotting this in a chart or backtesting similar setups? Or want help setting this up in MQL5?

Gold (XAU/USD) Intraday Buy Setup – Demand Zone Reversal with 3.Timeframe: Appears to be intraday (possibly 5-15 minutes).
Indicators:
EMA 30 (red): Showing recent bearish momentum.
EMA 200 (blue): Positioned above, indicating a longer-term bearish trend.
Candlestick Pattern: After a steep drop, price shows signs of consolidation and potential reversal.
📌 Trade Setup (Long/Bullish Bias)
Entry Zone: Around $2,963.2
Price is expected to pull back into this purple demand zone before moving up.
Stop Loss (SL): $2,956.1
Placed below the support zone to limit downside risk.
Take Profit (TP / Target Point): $2,988.2
A previous supply zone near the EMA 30, where selling pressure could return.
📊 Risk-Reward Ratio
Risk: $2,963.2 - $2,956.1 = $7.1
Reward: $2,988.2 - $2,963.2 = $25
RRR (Reward-to-Risk Ratio): ~3.5:1
This is a solid ratio, suggesting a high-potential trade if the setup plays out.
📈 Bullish Scenario
Price pulls back into the demand zone (entry).
A bullish candlestick confirmation or wick rejection could trigger a buy.
Target is the previous structure + EMA zone.

XAUUSDoverall , XAUUSD is bullish , i am eyeing on the 2 levels to see if there is any good reaction to buy from ( orange zones)

Gold (XAUUSD) Bullish Breakout Setup – Targeting 3,394.56 After EMA 30 (Red Line): Currently at 3,109.56
EMA 200 (Blue Line): Currently at 3,064.85
Price is above both EMAs, indicating bullish momentum in the short and long term.
📈 Trade Setup:
Entry Point: Around 3,162.15
Stop Loss Zone: Below the purple support box around 3,109–3,141 (right above the 30 EMA)
Target (Take Profit): 3,394.56 — marked as "EA TARGET POINT"
📊 Strategy Outlook:
Bullish Setup: The price recently broke out of a resistance zone (purple area) and retested it, confirming the breakout.
The risk-to-reward ratio appears favorable, as the target is significantly higher than the stop loss.
The upward price projection suggests confidence in a strong bullish continuation.
⚠️ Things to Watch:
Volume confirmation and price action near the entry level.
If price closes below the 30 EMA, it may invalidate the setup.
Always consider broader macroeconomic or fundamental factors when trading gold (e.g., USD strength, interest rates, geopolitical tension).

Gold is ShortI will be waiting for this pullback to mitigate the supply zone in which is my POI ... then i will see how it goes .
Happy Trading

Result: Gold(April 7)The price has moved about 690 pips relative to the specified levels. The strategy a trader uses to enter the market and how much of this profit they’ve secured varies among traders. If you’ve got even half of this movement as profit, that’s excellent! :)
You should note that the levels are based on price action knowledge, and no indicators are used to determine these levels. Therefore, the reaction ranges could occur a few pips above or below the levels marked on the charts!

#XAUUSD – H4 Time Frame Analysis
## 🟡 **#XAUUSD – H4 Time Frame Analysis**
🧭 **Refining the Chart:**
Switching from the **Daily to the 4H chart**, we can clearly spot some **key levels** worth watching.
✅ The **$3012–$3027** zone acted as a **strong demand area**, and as expected, we got a **solid bullish H4 candle close** 🔥 from that zone — just like we highlighted during Friday’s session.
📈 **Bullish Expectation:**
I’m expecting **further upside** on gold.
Minimum target zones to watch:
- 🎯 **$3070**
- 🎯 **$3084**
🔄 These levels might trigger **temporary rejection or a reversal**, so stay cautious as price approaches them.
🕒 **What’s Next?**
I'm about to share the **H1 setup** shortly, where we’ll plan our **precise buy or sell levels** 🔍. Stay tuned! 🔔
🚨 **Important Note:**
If price **breaks below $3000** and we get a **bearish H4 candle close**,
we will **shift to a sell bias**, targeting:
- 📉 **$2950**
- 📉 **$2932**
Aggressive Trader May Switch to Sell below 3015 H4 Fully Bearish Candle

Gold Buying setupAfter Sweeping London Lows there should be momentum to the upside. Be careful with your margin todays volume is at its highest as we see trumps taxes raise crashing all the stock market
Stay safe

Short term pull back1. Bearish divergence on daily chart
2. Support at $2855 with 0.5 Fibonacci level
3. Lower boundary of uptrend channel
What do you guys think?

4/10 Gold Trading StrategiesGold maintained a bullish tone yesterday, with prices recovering steadily toward the 3100 level, offering smooth trade opportunities and favorable returns.
However, today presents a significantly more complex trading environment due to several high-impact events:
🇺🇸 US CPI (MoM + Core CPI)
📝 Initial Jobless Claims
🗣️ Fed speakers including Barkin and Schmid
Technically, gold is now at a crucial inflection point , where market interpretation diverges:
If this is merely a corrective rebound in a broader downtrend , the move may be near completion.
If instead it's a healthy retracement in an ongoing uptrend, we could be in the middle phase of a continued climb.
Given the mix of technical ambiguity and fundamental uncertainty, a neutral and reactive trading stance is essential today.
🎯【Recommended Strategy & Positioning】
Trade Against Emotional Swings
Avoid chasing price during high-volatility news. Look to sell after sharp rallies and buy after sharp dips , minimizing exposure to emotional trades.
Key Zone Analysis – Watch the Trapped Orders
3128–3158: Zone where many long positions may be trapped — watch for selling pressure.
3016–2978: Former short-entry zone — potential area for long-side reactivation if retested.
📌【Today's Key Trade Zones】
🔻 Sell Zone: 3143 – 3168
🔺 Buy Zone: 3013 – 2979
🔄 Flexible Zone 1: 3109 – 3058
🔄 Flexible Zone 2: 3045 – 3013
❗ Above 3170, focus only on short positions — avoid chasing long trades at elevated levels.

09-04-2025 _ Short Term Bullish Idea _ XAUUSD H11- Bullish Divergence.
2- Price action again retested the support zone and rebound.
3- Strong bullish engulfing candle.
4- Expect a push up to the Fibo. levels

Have the gold bulls made a comeback?From the 4-hour analysis, the upper resistance is around 3055-60 in the short term. If the pullback does not break this position, the decline will remain unchanged. The lower target continues to break the bottom. The short-term long and short strength watershed is 3077-3085. Before the daily level breaks through and stands on this position, any pullback is a short-selling opportunity. The main tone of participating in the trend remains unchanged.
Gold operation strategy:
Gold rebounds at 3056-3060, short line, rebounds at 3077-85, covers short position, stop loss at 3089, target 2985-2990 line, continue to hold if position is broken;

XAU/USD - Potential TargetsDear Fellow Traders,
Gold is testing a key resistance area, already indicating rejections.
A potential correction - "SHORT" then "LONG".
## For the correction: The green 30min bull trend must be breached first.
If resistance (red confluence) is breached, rally will just continue.
Feel free to ask if anything is unclear.
Thank you for taking the time to study my analysis.

check the trendIt is expected that the upward trend will form to the specified resistance range. Then there will be a possibility of a trend change.
As long as the price does not consolidate above the green resistance range, the downward trend will continue.

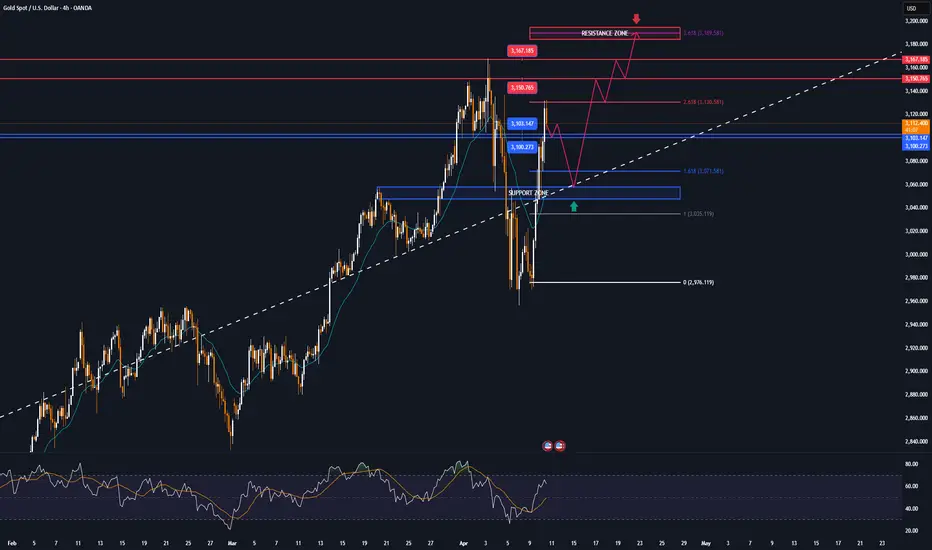
4th wave correction on GOLD3rd wave has extended and reached 3.167. Assuming price will hit the base channel which will be around 0.382 retracement level. Then, I guess it will start its journey for the 5th wave on september.
OANDA:XAUUSD

Neutral Stance on XAUUSD: Testing Resistance Hi there,
XAUUSD is currently testing the resistance area at 3017.221. If the price manages to break through this level due to the current bullish pin bar, we might see a test of the 3113.453 area.
However, the price as shown by the indicator suggests that the resistance area is strong, and we may see a push lower to test the break of structure 1, possibly nearing 2921.243, before turning bullish.
Overall, the current trend is bullish, but the market trend is bearish. If the price falls sharply to break (HH1) and forms a lower high below it, then (H) might be broken. If the initial high, the third high from (3), fails to hold, then the trend will reverse.
The current candle bias, however, is neutral or cautious.
Happy Trading,
K.
Not trading advice.

GOLD surges to weekly targets, eyes era levelsSpot gold prices have surged on the back of US President Trump’s tariff announcement. Gold prices rose as much as 3.9% on Wednesday as markets were volatile, before closing up 3.4%. At the time of writing today, Thursday (April 10), gold is up as much as $44, or 1.4%, on the day.
Gold prices posted their biggest one-day gain in 18 months on Wednesday as confusion over US President Donald Trump’s tariff agenda prompted investors to buy the precious metal as a safe-haven asset, Bloomberg reported.
But after China announced plans to retaliate with 84% tariffs on US products starting Thursday, Trump immediately raised tariffs on China to 125%. The moves raised concerns that the world's two largest economies were heading toward a full-blown trade war.
Stock markets rallied after Trump announced the tariff suspension. US stocks had their best day since the financial crisis, with the S&P 500 index rising nearly 10% after falling to the brink of a bear market last week.
Bloomberg said the US government's erratic tax plans have shaken the world as investors look for direction and certainty. That has supported gold prices overall, with prices up 18% this year. Expectations of further monetary easing by the Federal Reserve and central bank gold purchases have also boosted prices.
Gold has gained more than $400 this year, hitting an all-time record of $3,167.57 an ounce on April 3.
Minutes from the Federal Reserve's March meeting showed policymakers almost unanimously warned last month that the U.S. economy faces the risk of rising inflation while economic growth slows. Some policymakers noted that there could be "difficult trade-offs" ahead.
According to CME Group's FedWatch tool, traders see a 72% chance that the Fed will cut interest rates in June. Gold itself does not generate interest rates, and will perform well in a low-interest-rate environment.
Investors are now looking to the U.S. consumer price index (CPI) due out today (Thursday) for further trading information.
Technical outlook analysis OANDA:XAUUSD
On the daily chart, gold surged to hit all the weekly upside targets noted and readers in the weekly publication at $3,056 in the short term and then the full price point of $3,100. Looking ahead, gold only has a $3,150 size creature to break to set a new all-time high or more.
The relative strength index (RSI) is building, signaling bullish energy in the near term, as long as gold remains in the price channel, the declines should only be limited corrections and not a trend.
As we have noted to our readers throughout our articles since Trump returned to the White House, dips can be viewed as buying opportunities.
And for the day, the notable positions for the bullish picture on the technical chart of gold will be listed again as follows.
Support: 3,103 – 3,100 – 3,056 USD
Resistance: 3,150 – 3,167 USD
SELL XAUUSD PRICE 3192 - 3190⚡️
↠↠ Stoploss 3196
→Take Profit 1 3184
↨
→Take Profit 2 3178
BUY XAUUSD PRICE 3050 - 3052⚡️
↠↠ Stoploss 3046
→Take Profit 1 3058
↨
→Take Profit 2 3064
XAUUSD: Downtrend intact as bears tighten their gripOANDA:XAUUSD is continuing to move within a clearly defined descending channel on the H1 timeframe. The price structure shows that the Bears still control the market as each pullback is rejected right at the upper trendline.
Currently, price is reacting around the confluence zone between the dynamic resistance line and the previous distribution area. There is no sign that buying pressure is strong enough to break the descending channel. Instead, price action is showing weakness and hesitation from the buyers.
The support zone around 2,955 continues to serve as the final foothold for the current downtrend. If this area is breached, the sell-off could accelerate sharply, pushing price toward the 2,880 region, where the lower boundary of the channel quietly awaits.
Until the technical structure changes, the downtrend remains the main scenario. There is no reason to look for buying opportunities at this time.

XAUUSD Update: Bullish or Bearish? Key Levels to Watch! 🚨 Attention Traders! 🚨
XAUUSD is making waves and breaking through key levels! 🔥 The price is currently battling between 2980 and 2989 — will we see a breakout soon?
Bearish Alert: A dip below this range could lead us to targets like 2860 and 2850. ⚠️
Bullish Opportunity: A move above 2989 could trigger buying opportunities, with targets around 3004 and 3027. 🚀
💬 Let’s Talk Strategy! What’s your take on this? Share your insights as we ride this golden wave together and unlock new opportunities! 💰

GOLD (XAUUSD) 30-Min Chart Analysis – Key Reversal & Breakout Zo200 EMA (blue): 3085.72 (bearish as price is below it)
30 EMA (red): 3033.52
Current Price: 3034.10
🟪 Key Zones (Highlighted in Purple)
Resistance Zone: Around 3045.54–3065.70
Support Zone: Around 2968.27
Previous High Zone / Target Area: 3158.42
📉 Short Trade Setup (Blue Arrow Going Down)
Entry Area: If price rejects the resistance zone around 3045–3065
Stop Loss: Above the zone, around 3065.70
Take Profit: At the support zone, 2968.27
Risk-to-Reward: Approx. 2.4x (shown as -2.43%)
📈 Long Trade Setup (Blue Arrow Going Up)
Entry Area: If price breaks and holds above the 3065.70 zone
Stop Loss: Below 3045.54 zone
Take Profit: 3158.42 (previous resistance)
Risk-to-Reward: Approx. 3.0x (shown as 3.00%)
💡 Analysis Summary
Price is currently ranging just below the resistance zone.
Two possible scenarios:
Rejection from the zone → short entry.
Breakout above zone → long opportunity.
Use EMA alignment for confirmation:
Bearish if price stays below both EMAs.
Bullish if price breaks above 200 EMA (3085.72).

Gold TA 25.4.5Hello everyone, I hope you're doing well. In the 1-hour timeframe, the price of gold has taken a downward trend and has formed two lower lows. There is a very strong order block visible on the chart, and I expect that after the price retraces to this order block, it will react and continue to move down. We will wait for the price to reach this order block, then in the 5-minute timeframe, we will take the right trades and enter a short position. Keep in mind that in higher timeframes, the market is moving upwards, so short positions carry higher risk.
⚠️ This Analysis will be updated ...
👤 Sadegh Ahmadi: GPTradersHub
📅 25.Apr.5
⚠️(DYOR)
❤️ If you apperciate my work , Please like and comment , It Keeps me motivated to do better

GOLD GOLD ,3044-3049 WILL TRIGGER A BUY WHICH WILL SET UP another wave of bullish rally into 3088-3085...1000pips a day buy from 3071.
no one can see tomorrow
but we can make today better day.
