Gold Technical Analysis – Bullish Momentum Targeting 3165Chart Explanation:
This is a 4-hour chart of Gold Spot vs. U.S. Dollar (XAU/USD) published on April 10, 2025. It highlights a key technical setup with the following elements:
1. Support Zone (Blue): Around the 2,950 - 3,000 USD range. This area acted as a strong demand zone where price bounced upward after a sharp decline, indicating buyer interest.
2. Resistance Zone (Red): Near the 3,160 - 3,170 USD level. This area previously rejected upward momentum, making it a potential zone for price reaction again.
3. Recent Price Action:
Price had a strong rally from late March, creating higher highs.
It then experienced a correction down to the support zone.
The market reversed sharply from support, breaking out of the descending channel (red zone), and is now heading upward in a strong bullish leg (blue zone).
4. Target Price: The chart shows a bullish projection targeting 3165 USD, which aligns with the previous resistance zone.
5. Expected Move (Green Arrow): Suggests a possible minor pullback before continuing the bullish move towards the target.
Summary:
Gold is currently in a bullish phase after bouncing off support, and it's targeting the 3165 level. Traders may look for buying opportunities on pullbacks as long as price stays above the support zone.
USCGC trade ideas

GOLD TO 4000$HELLO TRADERS
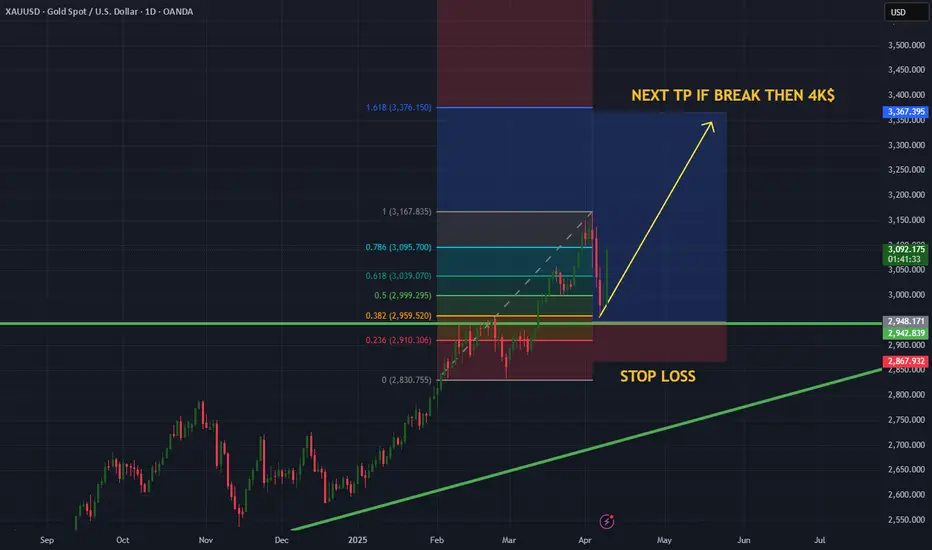
As i can see chart fib retracment to golden ratio is performed beautifully and now its time to load up ur bags for more bullish on gold as we can see Trump Trade War and geopolitical movements around the world is an great oppritunity for Gold bulls and investors always choose safe haven highly volotile markets in these days so trade carefully make a proper research befor taking any trade tomorrow CPI can mainpulate many retail tradres so always follow the levels each dip is an oppritunity Share ur thoughts with us on Gold chart
Stay tuned for more updates
Need to pushes above for Bull recovery [Short Term]
Bull momentum might catch up above 3084/3076.
Meanwhile, downside opportunity continuation below 2972/2970 critical support level.
Short-term / momentum builds watch for level 3018, above this level suggesting bull participant intensify.
Should downward movement continuation confirmed, watch for level:
2978 / 2972 / 2966 / 2954 / 2937 / 2879 / 2853 / 2834 / 2782 / 2770
key benchmark for maintaining the long-term trend:
2727 - 2643
and
2594 - 2543

Where will gold go after the sharp drop?The gold daily line decline structure continues to fluctuate downward, the moving average opens downward, and the RSI indicator runs below the central axis. The rise is not continuous, and the tariff policy still has an impact on the market. Yesterday, the market reported a 90-day tariff suspension. It can be seen that US stocks, crude oil, gold and silver are all rising rapidly, and then it is confirmed to be false news, and then they fall back quickly. It can be seen that as long as the impact of the tariff news does not change, all assets will continue to sell.
At present, the market is in a two-way power game between the selling of risky assets and the rising demand for risk aversion. Although gold is a safe-haven asset, it is also facing the pressure of liquidity withdrawal. In the context of the unclear Fed policy and the continued escalation of global trade concerns, the gold price may continue to maintain a volatile pattern, and the main idea is to sell at a high level!
However, the current fluctuation is too fast and the amplitude is too large, so short-term operations may not be easy to start, but the direction is still the most important, and the entry point is secondary, which means that gold will continue to fall sharply. Gold hit 2956 and then bottomed out and rebounded, but the recent market is actually volatile. Because the fluctuation is relatively large, it is reasonable to have a larger amplitude, but it increases the difficulty of operation. Gold fell back after rising again, and now it is in a large range of fluctuations, but overall, shorts are still dominant.
Yesterday's Asian session had a new low, and NY time had another new low. In such a market environment, new lows continue to appear, which is a short market. When the 3000 point fell below, many investors' faith collapsed, and they firmly believed that they could hold the 3000 mark and break it at this moment, which means that the current downward trend has not ended yet, and they continue to sell with the trend.
The gold 1-hour moving average continues to cross downward, and the downward momentum has not weakened; the rebound continues to sell. Although gold rushed up after filling the gap in 1 hour, it fell down quickly. Overall, it is still weak, and the short-term resistance is around 3030!
Today's rebound is under pressure near 3030, but you can still continue to sell. The market is changing rapidly. Although gold seems to rebound strongly, it eventually rises and is blocked and then falls. Gold is still the home of short sellers, but now it is more volatile. Be patient and wait for a rebound. You can sell near the resistance level. Pay attention to patiently wait for the rebound and sell near the resistance level.
Key points:
First support: 2978, second support: 2963, third support: 2955
First resistance: 3000, second resistance: 3013, third resistance: 3030
Operation ideas
Buy: 2975-2978, SL: 2966, TP: 3000-3010
Sell: 3030-3033, SL: 3042, TP: 3010-3000;

DeGRAM | GOLD reached the lower boundary of the channelGOLD is in an ascending channel between the trend lines.
The price has already reached the lower boundary of the channel.
The chart is forming a descending structure and is holding under the 50% retracement level.
We expect the decline to continue.
-------------------
Share your opinion in the comments and support the idea with a like. Thanks for your support!

XAUUSD H12 IdeaGold Rally Pauses, But Bullish Trend Holds
Gold hit an all-time high of $3,167.84 earlier this week amid safe-haven buying sparked by President Trump’s new tariffs and China's retaliatory duties, which intensified global recession fears. The resulting forced selling in equities caused a brief pullback in gold prices. However, this dip is seen as mechanical, not sentiment-driven, with gold still up over 15% this year, supported by central bank buying, strong institutional interest, and ETF inflows. The pullback is likely temporary unless new macroeconomic shifts emerge.
Ongoing Risks Support Gold’s Long-Term Bullish Outlook
Despite recent market volatility, the drivers behind gold’s rally remain intact. Mohamed El-Erian raised U.S. recession odds to 50%, while Goldman Sachs raised theirs to 35%. The Fed has warned of slower growth and higher inflation due to tariffs, and gold's role as a hedge against these risks is vital.
Focus on Upcoming Data
Next week, key data will be in focus: the FOMC minutes on Wednesday, CPI report on Thursday, and consumer sentiment data on Friday. If CPI surprises to the upside or the FOMC minutes reveal a more dovish stance, gold could see renewed buying interest. Traders should view pullbacks as buying opportunities, as inflation, trade tensions, and recession risks continue to support gold.
Technical Outlook
If gold tests support at $3,000.28 and holds, it may attract new buyers. A break below could bring the $2,852.34 level into play. Shorting is risky, but if pursued, exit over $3,167.84 with objectives at $3,000.28, $2,852.34, and the 52-week moving average at $2,601.40.

Gold's trend has too many friendsThere’s a well-known saying in trading: “The trend is your friend.”
I firmly believe in this principle. However, when price movements become too extreme—too fast and too far—it’s wise to exercise caution, even if you’re not ready to take the opposite side of the trade.
And right now, I believe that’s exactly the case with Gold.
________________________________________
Why a Major Gold Correction is Likely
As I’ve been repeating like a broken record since Monday, Gold’s price is severely deviated from the mean, signaling that a brutal correction is on the horizon.
After reaching a new all-time high of 3,150, Gold retraced yesterday, dropping to 3,100—a support level formed earlier in the week. A rebound followed, but as I’ve explained in an educational article, this price action looks more like a stepwise distribution rather than true buying strength.
The key point?
➡️ Support isn’t holding because buyers are stepping in—it’s holding because big sellers have paused selling.
________________________________________
Still Bullish, But a Drop is Coming
There’s no doubt that Gold is in a strong uptrend. But even if it drops 1,000 pips, the overall bullish trend would still be intact.
Key Technical Signs of Weakness
📉 Trendline Break – Yesterday, Gold broke below the rising trendline, marking the first sign of weakness.
📉 Failed Rebound – Despite a short-term bounce, the price is now more likely confirming the break rather than invalidating it.
📉 Lower High in Progress? – The next minor support sits at 3,120. If Gold breaks below this level, we’ll have confirmation of a lower high, which strengthens the bearish case.
________________________________________
Targeting the Correction
If Gold breaks below 3,120, I expect a move below 3,100, targeting:
🎯 Soft target: 3,080
🎯 Likely target: 3,030 – 3,040
I believe it’s only a matter of time before this brutal correction plays out.
Let’s see how it unfolds! 🚀
Disclosure: I am part of Trade Nation's Influencer program and receive a monthly fee for using their TradingView charts in my analyses and educational articles.

Gold short-term analysis, follow up and buyPolicy expectations and news are dominating the market. Tariffs have been upgraded again. Gold rose sharply to 3099.4 in late trading, close to the 3100 mark, and retreated sharply by more than $50 to 3048 before closing. The daily chart closed sharply higher. The New York closing price of the daily chart once again stood on the MA10 daily average, with a daily increase of more than 3%.
From a technical point of view, the rebound to 2956 at the beginning of the week ushered in a rebound, and the lows gradually moved up. The big rise closed on Wednesday, so the previous 2956 position formed a bottoming performance, and the Bollinger Bands narrowed more and more obviously. The technical conditions for this wave of bottoming have been met, so there was a bullish outbreak in the US market on Wednesday. As long as the current gold market stands firmly at 3100, it can continue to look up to 3136 or even 3167 or higher.
In the 4-hour chart of gold, we can see that the market has been rising all the way, forming a bottom low at 2956, and 2970 is the shoulder of the head and shoulders bottom. In the short term, we will first see whether it can stand above 3100, and then see whether it can form a unilateral surge and reach a new high. Therefore, trading should still be based on buying.
The lower support can refer to the resistance turning into support after breaking through 3100, followed by the US market retracement position of 3062 on Wednesday. Make effective purchases above these positions, and wait for the next support position to continue to go long after breaking through. As long as these two positions are maintained, the short-term bullish trend will remain unchanged.
Key points:
First support: 3100, second support: 3073, third support: 3062
First resistance: 3118, second resistance: 3136, third resistance: 3154
Operation ideas:
Buy: 3098-3102, SL: 3090, TP: 3120-3130;
Buy: 3062-3065, SL: 3053, TP: 3090-3100;
Sell: 3133-3136, SL: 3145, TP: 3100-3080;

XAUUSD: Latest Analysis StrategiesThe main driver of the rally comes from the news that the United States will impose tariffs of up to 104% on imports from China starting Wednesday. This decision has sparked concerns about a potential global economic recession, thereby boosting demand for safe-haven assets like gold.
In addition, the market is expecting the Federal Reserve (Fed) to begin a rate-cutting cycle soon, with over a 60% chance of it happening as early as May, and a projected five more rate cuts in 2025. This expectation is weakening the USD, further supporting gold prices. Although some Fed officials continue to deliver hawkish signals, concerns that tariffs could increase inflation remain and are putting pressure on the Fed's upcoming policy decisions.
From a technical standpoint, an effort to shift the trend has formed above the resistance of the descending trend channel, and price is now reacting near the key resistance level at 3057. A breakout and price consolidation above 3057 will trigger the continuation of the current upward move. A retest of the previous broken consolidation resistance at 3020 may also occur.
The market structure is fully bullish. A breakout above key resistance or a pullback to support levels will likely lead to the next phase of growth, but if the 3057 level is broken earlier than expected, it could eventually push this metal up to 3110.

Gold bulls return strongly, can they continue?The gold market is currently in the mid-term adjustment stage of the bullish trend, and the technical side shows three typical characteristics: first, the price has built a standard shock box in the range of US$2955-3055; second, the daily Bollinger Bands continue to narrow to a bandwidth of US$23, a new low in nearly a month, indicating a significant contraction in volatility; most importantly, the 4-hour level has begun to show the embryonic form of a head and shoulders bottom pattern, with the left shoulder at US$2970, the head at US$2955, and the neckline at US$3055. This technical structure suggests that the market is brewing a breakthrough, but a major catalyst is needed to confirm the direction.
Analysis of key time and space nodes
From the perspective of time, the Asian session on Wednesday (02:00-14:00 GMT) needs to closely observe the breakthrough of the short-term resistance of US$3025, especially in conjunction with the volume analysis to confirm the effectiveness of the breakthrough. Entering the US session (14:00-22:00 GMT), the market focus will shift to the competition for the double top resistance of US$3055, which is often accompanied by increased volatility caused by data shocks. It is particularly noteworthy that the minutes of the Federal Reserve meeting will be released early Thursday morning (02:00 GMT), which is likely to become a key catalyst to break the current deadlock.
Key positions for long and short games
Through multi-time frame analysis, we have identified the following key positions:
Short-term level: $3025 is a bullish attack signal, and $2980 is a bearish defense line
Mid-term dimension: $3055 is a trend confirmation level, and $2955 is a bullish and bearish watershed
Long-term perspective: A breakthrough of $3150 will open up new upside space, while a loss of $2900 may trigger a trend reversal
Based on the current technical structure, the following trading strategies are recommended:
Main strategy (long layout):
Position building range: $2990-2995 (Fibonacci 50% retracement level)
Stop loss setting: $2982 (double protection below the previous low + integer level)
Target system:
The first target is $3025 Yuan (short-term profit-taking point)
The second target is $3055 (confirmation point of pattern breakthrough)
The ultimate target is $3100-3150 (trend extension zone)
Auxiliary strategy (breakthrough follow-up):
After breaking through $3025 in the Asian session, wait for a retracement to $3015 to add 2%
When the US session breaks through $3055, you can chase 3% more positions
Use a 30-point moving stop loss to protect existing profits
Risk warning and management should focus on the following risks:
Policy risk: If the Fed minutes release hawkish signals, it may suppress gold prices
Data risk: US economic data exceeding expectations may trigger a technical correction
Liquidity risk: Asian session false breakthrough and US session volatility increase
Technical risk: A breakout of the $2955 low may trigger a programmed sell

Gold Expecting bullish Movement This isn’t just another chart this is the result of deep observation experience and structured analysis
I’ve shared accurate setups before and once again I’m bringing a well calculated idea to the table
Those who truly understand price action will see that this isn’t a random guess—it’s professional trading.
Let the market unfold. I’m already positioned with confidence

Gold Price at a Crossroads: Awaiting the Next MoveCurrently, I foresee two possible scenarios for XAUUSD. In the more optimistic scenario (black label), the recent correction is assumed to be wave ii of wave (v), which suggests that XAUUSD still has the potential to strengthen toward the 3,177–3,306.
However, attention should also be given to the bearish scenario (red label). If XAUUSD fails to break above the 3,167 resistance level, it is likely that wave 3 has already been completed, and the current movement is part of wave 4. In this case, XAUUSD may decline toward the 2,489–2,832.

#xauusd #GoldLevels where price reactions are most likely to occur during the day. Naturally, at each level, you can have buy and sell positions.the levels are updated daily!
The results of price reaction to these levels will be shown in the upcoming videos.

XAUUSD weekly analysis Gold has been in a downtrend covering pass liquidity zones, right now price seems most likely about to pullback maybe to chase a new all time highs. If price fail to do so we can se price go back to the levels of 2980 or 2930. Taking in count the narrative of the world right now, everything can happen this new week.
Hopefully we will be ables to see a new all time highs this week.
GFX SAN. :))

I told you !Hello Traders 🐺
In the last couple of weeks, my only bearish idea was about the GOLD price, and I mentioned that somewhere around $3100 would be the top — at least from a mid-term perspective.
Now, as I told you before, price created a fakeout from the rising wedge pattern, which is inherently a bearish pattern!
But we had a bullish breakout with a bearish divergence on the RSI, so what came next was so obvious!
Now I’ve mentioned two price targets for GOLD in the immediate short term on the chart — make sure to act accordingly.
And what about the mid-term? You can check my last idea about GOLD in the related link below this idea.
But about the total financial market, I have to admit that there is a chance for recession,
but honestly, I can’t feel it, because the danger of recession is much higher than inflation.
And also, with the recent tariffs, I can say Donald Trump wants to grow the US economy, and that’s not going to happen through recession.
However, let me explain all of this in detail in the next idea...
I hope you enjoyed this idea — and always remember:
🐺 Discipline is rarely enjoyable, but almost always profitable 🐺
🐺 KIU_COIN 🐺

GOLD - Price will make correction movement to support levelHi guys, this is my overview for XAUUSD, feel free to check it and write your feedback in comments👊
Some time ago price started to grow inside a rising channel, where it soon reached $2940 support level and broke it.
Then it some time traded near this level and then continued to grow in channel and soon reached resistance line of channel.
Soon, Gold reached the $3055 level and then corrected to the channel's support line, after which it turned around.
XAU reached $3055 level again and broke it, aftr which continued to grow and recently, it reached almost resistance line.
But soon, it turned around and started to decline, so, in my mind, Gold can continue to decline to $3055 level.
If this post is useful to you, you can support me with like/boost and advice in comments❤️

"Buy the rumor, sell the news"A successful agreement between Iran and the US, or continued tensions in the Middle East and bullishness in gold?!
Positive candlestick patterns and hidden bullish divergence in gold.

Why 77 Might Be the Most Important Number in Gold Right NowLast week’s analysis played out perfectly, securing over 2,500+ pips as forecasted. This move was largely driven by a blend of technical setups and fundamental catalysts, particularly the ongoing U.S. China tariff war which increased gold’s safe haven appeal.
FUNDAMENTAL BACKDROP:
China’s tariff hike to 125% on U.S. goods has rattled global markets, weakening the U.S. dollar and pushing gold higher.
Continued macroeconomic uncertainty, rising inflation fears, and tensions over U.S. trade policy all favor a bullish long-term outlook for gold.
Upcoming Events to Watch:
U.S. Retail Sales and CPI data this week.
Any further developments in the U.S. China trade standoff.
Fed speeches that could impact dollar strength.
Weekly Timeframe:
Gold retested a key weekly break of structure and closed with a bullish engulfing candle, suggesting continued upside.
Daily Timeframe:
Three of the most aggressive bullish candles we've seen this year showing strong institutional momentum.
4-Hour Channel Breakout:
A clear bullish breakout from a tight 4H channel, showing potential for continued expansion.
Leading in to next week if we start to see a pull back before a continued rise we can look to buy gold at 3190 or 3077.
KEY LEVELS TO WATCH THIS WEEK:
Buy Zones:
3109 a shallow pullback before continuation.
3077 – a key golden zone level backed by multiple confluences:
0.618 Fibonacci Retracement
4 hr and daily order block
Daily candle meet
Friday saw us find resistance from a trend line and pivot point.
Firstly marking golds current low to high we will find these to numbers as golds golden zone. Along with the 4 hr 50 ma
A deeper correction to 3077 would be a stronger buy. As you know I ve covered the importance of this number and gold. Linked here
But also 3177 offers also has a gap to be filled from Fridays open.
Using 3077 as confluence for the contiune of the rise of gold. Using fib extention tool we can target 100% extention of 3352.
Gold remains fundamentally strong and technically bullish. Watch for either a shallow or deeper pullback into 3190 or 3077 to buy into continuation. With proper confirmation, we could see another leg targeting 3352+.

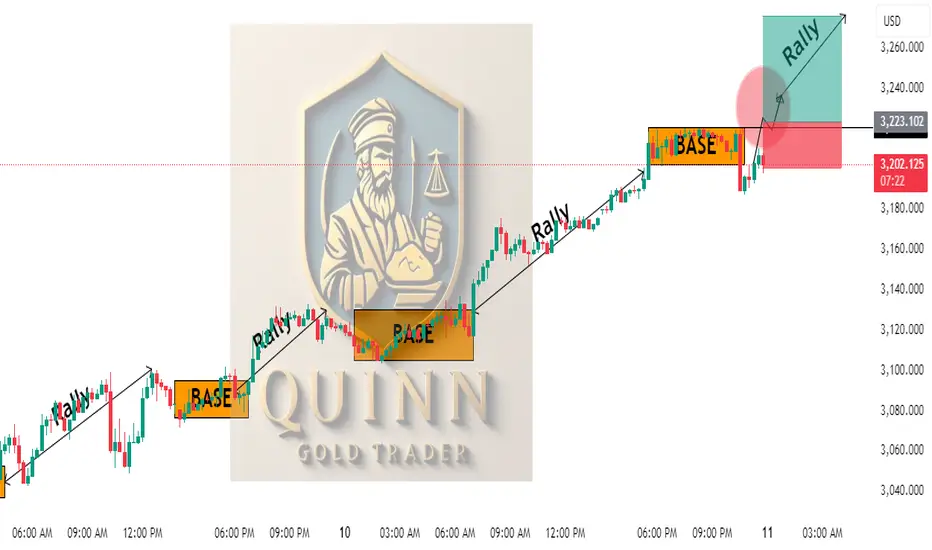
Gold XAUUSD Intra-day move 11.04.2025XAU/USD – Rally-Base-Rally Structure Forming a Bullish Continuation
The current price action on Gold (XAU/USD) showcases a classic Rally-Base-Rally (RBR) formation, indicating sustained bullish momentum in the market. Multiple rally phases followed by compact consolidation zones (bases) suggest strong institutional demand stepping in at each pause, propelling price higher with each breakout.
The latest base has formed in the 3,209–3,220 region, with price now attempting to reclaim this demand zone. If bulls successfully reclaim and hold above the 3,220–3,225 level, it will confirm the base as a valid support and set the stage for a fresh impulsive move to the upside.
Trading Signal:
If price stabilizes above 3,220, a long setup is favored with potential upside targets toward 3,250–3,260, following the RBR structure. Any clean rejection and reclaim of this base would provide a strong entry confirmation.
Please follow, comment, like and boost my idea to get more daily analysis.
GOLD Gold makes a Record High Above $3,200 fueled by Tariff Tensions and Dovish Fed Outlook by federal reserve
Gold prices rise fueled by rising safe-haven demand as the US-China trade war escalates and expectations continue to grow for a more tariff coming to balance united states trade imbalance with china .
dollar weak appeal is trading below 100 a potential redflag of a weak economy and a boost for EUR,AUD,JPY,CAD,CHF,NZD,GBP
investors and gold traders shares optimism after President Trump paused reciprocal tariffs for 90 days, while China now faces a 145% levy higher than the previously proposed 125%.
The US Dollar continue to sink further after CPI data disappointed,
Core CPI and weekly jobless claims (223K) signaled softer economic momentum, reinforcing bets of dovish stance by Fed and a potential rate cut in the coming months.
Asian and European stocks trading higher, Wall Street sinking by over 2.5%, indicating growing recession fears. Gold’s surge reflects heightened risk aversion and a flight to safety as markets brace for deeper economic downturn with trump

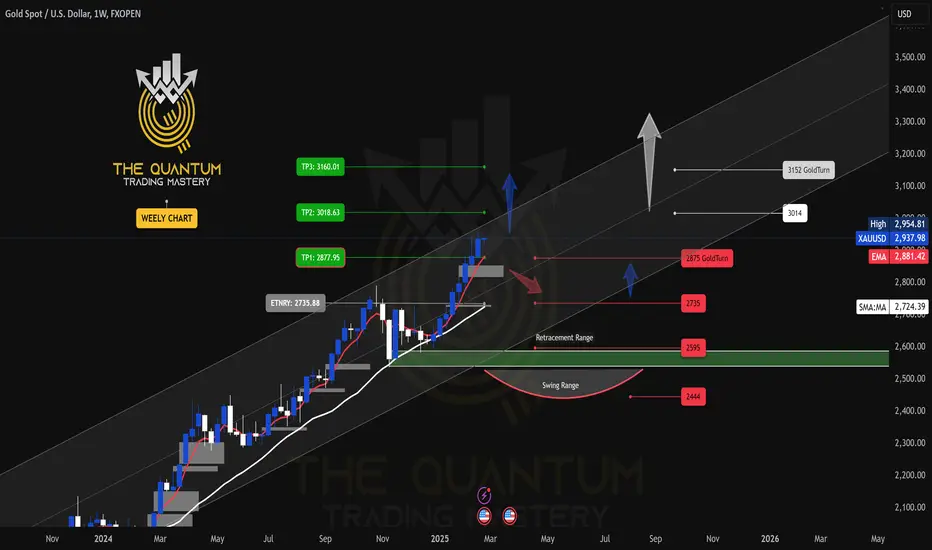
GOLD WEEKLY CHART MID/LONG RANGE ROUTE MAP UPDATEDWeekly GOLD Analysis: 24th February 2025
Hello Traders,
Here’s a weekly chart analysis of GOLD, offering an in-depth look at recent market trends and future outlook. Since October 2023, our consistent tracking has achieved 100% target accuracy, as shown by the Golden Circle markers on the charts. Let’s break down the highlights and what’s next.
Gold reached an all-time high of $2,954.80 last week. As previously noted, close attention to the movement of the 5-day Exponential Moving Average (EMA5) was advised. The anticipated Fair Value Gap (FVG) provided strong support at $2,850, with the EMA5 approaching the first take-profit (TP1) level at $2,877, leading to a bullish surge that touched the all-time high. However, the EMA5 has yet to cross and stabilize above $2,877.
This situation persists, with the EMA5 still not locked above $2,877, which is necessary for further bullish confirmation. If the EMA5 fails to cross and hold above this level, the price may reverse to test the GoldTurn level at $2,875 before potentially bouncing back upward.
The key level at $2,735 remains a critical zone. Active GoldTurn levels at $2,875 and $2,735 suggest that the price may revisit these areas before advancing to TP1 and beyond.
Recommendations & Strategy:
* Focus on EMA5: Watch its behavior around 2877 for key signals on short- and long-term trades.
* Support Levels: GoldTurn levels at 2875 and 2735 are vital for identifying reversal points and prime dip-buying opportunities.
* EMA5 detachment is still due on weekly chart.
For precise entry and exit points, check our daily, 12H, 4H, and 1H analyses for clearer market guidance.
We’ll continue to provide daily updates, insights, and strategies on our TradingView and YouTube channels every Sunday. Don’t forget to like, comment, and share to support our work and help others benefit!
The Quantum Trading Mastery
GOLD DAILY ANALYSYSGold Making new all time high and keeping up trend is the most expectation.
new target levels are appears clearly on the chart and breaking each line will move to the upper one.

Main trend is up again - soon to regain 3140 area🔔🔔🔔 Gold news:
➡️ Gold prices extended their earlier recovery to trade near $3,100 in the Asian session on Thursday. Safe-haven demand amid escalating trade tensions between the United States and China provided some support for the precious metal. The selling of the US Dollar (USD) remained unabated amid the prospect of multiple Fed rate cuts in 2025 and continued to benefit Gold prices
Personal opinion:
➡️ The main uptrend of gold has returned and the deep correction has ended. So it is safer for you to wait for technical pullbacks to buy at good prices
➡️ Analysis based on important resistance - support and Fibonacci levels combined with trend lines to come up with a suitable strategy
Plan:
🔆Price Zone Setup:
👉 Sell Gold 3138 – 3140
❌SL: 3145 | ✅TP: 3133– 3128 – 3123
👉 Buy Gold 3100 – 3102
❌SL: 3095 | ✅TP: 3107– 3113 – 3123
FM wishes you a successful trading day 💰💰💰
