USCGC trade ideas

#XAUUSD #GOLD SETUP WAS SHARED FOR FREEXauusd 180 pips Drop.. I shared Gold Short setup for free, if Someone has entered then enjoy profit.. you can join us for more Setup.. follow now

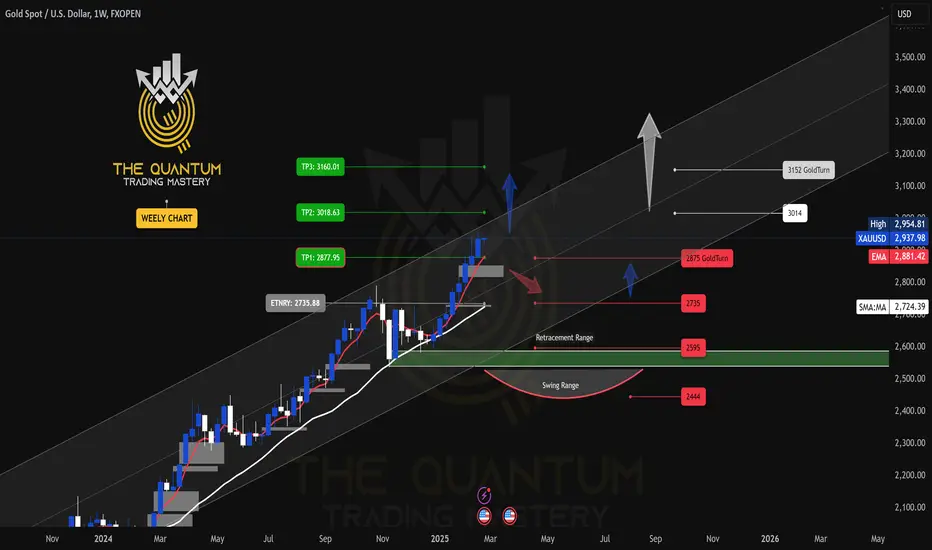
GOLD WEEKLY CHART MID/LONG RANGE ROUTE MAP UPDATEDWeekly GOLD Analysis: 24th February 2025
Hello Traders,
Here’s a weekly chart analysis of GOLD, offering an in-depth look at recent market trends and future outlook. Since October 2023, our consistent tracking has achieved 100% target accuracy, as shown by the Golden Circle markers on the charts. Let’s break down the highlights and what’s next.
Gold reached an all-time high of $2,954.80 last week. As previously noted, close attention to the movement of the 5-day Exponential Moving Average (EMA5) was advised. The anticipated Fair Value Gap (FVG) provided strong support at $2,850, with the EMA5 approaching the first take-profit (TP1) level at $2,877, leading to a bullish surge that touched the all-time high. However, the EMA5 has yet to cross and stabilize above $2,877.
This situation persists, with the EMA5 still not locked above $2,877, which is necessary for further bullish confirmation. If the EMA5 fails to cross and hold above this level, the price may reverse to test the GoldTurn level at $2,875 before potentially bouncing back upward.
The key level at $2,735 remains a critical zone. Active GoldTurn levels at $2,875 and $2,735 suggest that the price may revisit these areas before advancing to TP1 and beyond.
Recommendations & Strategy:
* Focus on EMA5: Watch its behavior around 2877 for key signals on short- and long-term trades.
* Support Levels: GoldTurn levels at 2875 and 2735 are vital for identifying reversal points and prime dip-buying opportunities.
* EMA5 detachment is still due on weekly chart.
For precise entry and exit points, check our daily, 12H, 4H, and 1H analyses for clearer market guidance.
We’ll continue to provide daily updates, insights, and strategies on our TradingView and YouTube channels every Sunday. Don’t forget to like, comment, and share to support our work and help others benefit!
The Quantum Trading Mastery
GOLD DAILY ANALYSYSGold Making new all time high and keeping up trend is the most expectation.
new target levels are appears clearly on the chart and breaking each line will move to the upper one.

Gold Holds Steady Amid Trade Tensions and Rate Cut HopesHello,
Gold edged higher on Tuesday, supported by a weaker dollar and escalating U.S.-China trade tensions, despite pressure from rising U.S. Treasury yields. Spot gold rose 0.1% to 2984.16 per ounce by mid-afternoon, while futures settled 0.5% higher at 2990.20.
The 10-year Treasury yield hit a one-week high, dampening gold's appeal. Still, ongoing trade uncertainty and potential U.S. interest rate cuts kept the outlook bullish. A break above 3,055 could open the path to 3130, with stronger resistance near 3272.314, while weakness below 3,000 might push prices down to 2950-2930.
Market anxiety intensified after President Trump’s announcement of a 104% tariff on Chinese goods, fueling safe-haven demand. Gold, up 15% this year, also benefited from a weaker dollar, which makes it cheaper for foreign buyers.
We now await Fed meeting minutes for clues on rate cuts, with a 40% chance priced in for May. Expectations of easing could drive gold prices higher in the near term.
The Support and Resistance outlined in green and red are the respective support/resistance for this pair currently for 1D-1Y timeframes!
No Nonsense. Just Really Good Market Insights. Leave a Boost
TradeWithTheTrend3344

Trade Summary: XAU Gold Buy Setup 17/04/2025Trade Summary: XAU Gold Buy Setup
Entry Price: $3220
Target: $3590
Stop Loss: $3150
Time: 05:18 PM
Timeframe: 4-Hour (H4)
Technical Setup: Price is forming a Higher High structure with a strong retracement, followed by another bullish push—suggesting potential trend continuation.
⚠️ Disclaimer: This is not financial advice. Trading involves risk, and you should do your own analysis or consult with a financial advisor before making any trading decisions.

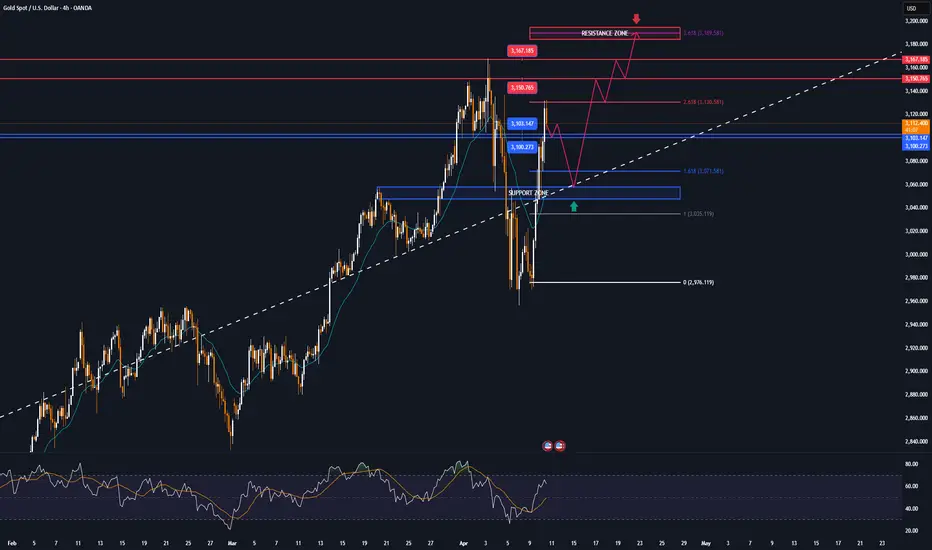
"Gold on Fire: Eyeing $3500 After RBR Zone Rebound! "1️⃣ Trend Overview
📈 Strong bullish rally from April 11 to the peak.
📉 Pullback after reaching the recent ATH (All-Time High) zone.
2️⃣ Key Zones
🔵 RBR Zone (Rally-Base-Rally):
Marked support area between $3,271.41 and $3,307.04.
Acts as a buy zone / entry point.
🟣 ATH Zone:
Minor resistance from the recent high.
Price pulled back from here before potentially continuing up.
3️⃣ Entry & Target
✅ Entry Point: Around $3,307.04 (top of RBR zone).
🎯 Target Point: Clearly defined at $3,500.71.
Potential Gain: +188.59 points
ROI: +5.70%
4️⃣ Indicator
📊 EMA (7, close):
Currently at $3,329.09
Price is slightly below EMA = short-term correction or pause.
Strategy Summary
🟢 Buy Setup:
Wait for price to return to RBR zone
Enter long position ✅
Target $3,500 🚀
⚠️ Risk Consideration:
Place stop-loss below RBR zone for safety.

Gold Market Sets for $3500 SurgeAfter the breakout from 3230’s and the early weekly pullback at 3196, gold market disbursed a strong bullish surge. Now, with the bullish stance firmly held, the market sets its pace for 3500 USD/oz—marking a potential new milestone in the ongoing uptrend. follow for more insight , comment and boost idea

CALLING A TOP!Not many analysts would dare to call a top but rather caution against overextended markets but i am calling it a top in gold!
EW COUNT CHECK
3.618 FIB LEVEL CHECK
PITCHFORK RESISTANCE CHECK
MARKET EUPHORIA CHECK
EXPECT BEARS TO COME IN HOT AND HEAVY!

XAUUSD NEXT MOVE IN 30MI Created This XAUUSD Chart Analysis In 30-M Tf
Entry: BUY from 3220
Support zone : 3220 / 3216
Target Will Be : 3240
OANDA:XAUUSD made parallel Channel and It take support and it went to Uptrend, Let me know your thoughts in comments section

gold oscillating trendDuring the decline on Monday, the H4 cycle did not break the Bollinger middle rail support point. We will wait for the mid-term adjustment of gold to be completed. There will be another wave of rise with the changes in the H4 mid-term. The upper side will first look at the high points of 3235-3245. Yesterday, it started to rise at 3193-3195. If it continues to rise, it will look at 3235-3245. Don't look too much at the rising space in the future. After completing this wave of rise, there may be adjustments for the small cycle. Today's long position is likely to be around 3200-3205. If it falls back to this point, you can continue to go long. The European and American sessions will see 3235-3245 in turn.
Gold operation strategy: short near 3235 above, stop loss 3245, target near 3200; long at 3200-3203 below, stop loss 3193, target 3220-3230;

GOLD BUY NOW!!!!!!!!Inside a bullish rectangular we have a falling wedge breakouts with a retest and price making its way up to run liquidity above 3,245 area to create new highs am in on buy from this zone holding till new highs is created
JOIN AND ENJOY...........

XAUUSD: 15/4 Today’s Market Analysis and StrategyGold technical analysis
Daily chart resistance 3300, support below 3176
Four-hour chart resistance 3250, support below 3190-3150
One-hour chart resistance 3250, support below 3210
Gold news analysis: Gold prices remained above 3200 on Monday, indicating that the overall market sentiment is still cautiously optimistic. The main factors driving this round of market conditions include uncertainty in the global trade environment, a weaker dollar, and continued warming of safe-haven demand. During the session, investors' reactions to the latest tariff remarks intensified gold price fluctuations, but fundamental and technical support remained solid, and the strong pattern of gold did not show any significant shakes. The trend of the US dollar played an important role in this round of gold price fluctuations. The US dollar index hit a three-year low, making gold denominated in US dollars more attractive to overseas buyers. Behind the weakness of the US dollar, there are both market concerns about the outlook for the US economy and the drive of diversified reserve needs of global central banks. Analysts from well-known institutions said that the weakening of the US dollar and global economic uncertainty constituted a solid support for gold prices. In addition, the global central bank's demand for gold purchases remains strong. Since the beginning of this year, many central banks have continued to increase their gold reserves to cope with potential currency fluctuations and geopolitical risks.
Gold operation suggestions: Gold opened lower yesterday and touched 3209 and then began to rise. It reached the historical high of 3245 again and then began to adjust and adjust. It retreated slightly in the European session and continued to accelerate in the US session. It bottomed out and began to rise after reaching 3193.
From the current trend analysis, today's upper short-term resistance focuses on the 3250 mark, and the lower support focuses on the one-hour level 3210 and the four-hour level 3190 support. In terms of operation, continue to buy in line with the trend when stepping back to this position. At the same time, gold is currently in a severely overbought state and beware of a sharp correction.
Buy: 3210near SL: 3205
Buy: 3190near SL: 3185

Gold is finishing at a high level to resist the fall! The bullis
📌 Driving events
U.S. President Trump said on Monday that he was exploring the possibility of temporarily exempting tariffs on imported cars and parts to give auto companies more time to establish production bases in the United States.
New York Fed: The unemployment rate is expected to rise to the highest level since April 2020 in March. In March, households were more pessimistic about employment and future income. The expected inflation rate for the next five years is 2.9%, down from 3% in February.
Geopolitical situation:
It was learned on the 14th local time that Israeli officials said that Israel and the Palestinian Islamic Resistance Movement (Hamas) still have great differences on the ceasefire in Gaza. The official said that compared with the previous negotiating position, Hamas seems willing to release more Israeli detainees, but if Hamas insists on requiring all parties to guarantee that Israel must stop waging war in the Gaza Strip after the ceasefire, it will still be difficult to promote an agreement. The official expects Hamas to respond to the new ceasefire proposal in the next few days.
📊Comment Analysis
The hourly level shows that the short-term gold price has fallen from a high level and gradually fell into a narrow range above the hourly 60-day moving average support level. The current hourly level indicators are narrowing, maintaining a short-term shock guide reference. The 5-day moving average and the 10-day moving average at the four-hour level are arranged in a downward cross, maintaining the four-hour level peak signal. The short-term decline gradually brings about the four-hour RSI mean reversion, forming a four-hour level adjustment trend. The gold price has risen and fallen to maintain a shock downward trend, which has not changed the medium- and long-term upward trend. Be cautious to maintain a bullish shock trading strategy during the day.
💰Strategy package
Long order:
Aggressive participation at 3185-3195, profit target above 3210
Steady participation at 3175-3185, profit target above 3195
Short order:
Aggressive participation at 3250, profit target below 3230
⭐️Note: Labaron hopes that traders can properly manage their capital
- Choose the number of lots that matches your capital
- Profit equals 4-7% of the capital account
- Stop loss equals 1-3% of the capital account

The XAU/USD pair may form a long-term Sell trendBased on the analysis, the XAU/USD pair may form a long-term SELL trend. Based on this analysis, we can try to enter a Sell position with a small risk margin.

GOLD-SELL Strategy 12 hourly chart GANN SQIt feels we are near the end of the run for the short-term and who knows, for the MT as well. It is overextended, even though we had some interim corrections, the overall correction has not taken place as yet.
Strategy SELL @ $ 3,200-3,25o and take profit near $ 3,097 for now.

"Buy the rumor, sell the news"A successful agreement between Iran and the US, or continued tensions in the Middle East and bullishness in gold?!
Positive candlestick patterns and hidden bullish divergence in gold.

Looks like a reversal Just put some rays on the chart to show trajectory. Math and geometry well calculated. You can see where it’s going next week, thanks for looking

GOLD Gold makes a Record High Above $3,200 fueled by Tariff Tensions and Dovish Fed Outlook by federal reserve
Gold prices rise fueled by rising safe-haven demand as the US-China trade war escalates and expectations continue to grow for a more tariff coming to balance united states trade imbalance with china .
dollar weak appeal is trading below 100 a potential redflag of a weak economy and a boost for EUR,AUD,JPY,CAD,CHF,NZD,GBP
investors and gold traders shares optimism after President Trump paused reciprocal tariffs for 90 days, while China now faces a 145% levy higher than the previously proposed 125%.
The US Dollar continue to sink further after CPI data disappointed,
Core CPI and weekly jobless claims (223K) signaled softer economic momentum, reinforcing bets of dovish stance by Fed and a potential rate cut in the coming months.
Asian and European stocks trading higher, Wall Street sinking by over 2.5%, indicating growing recession fears. Gold’s surge reflects heightened risk aversion and a flight to safety as markets brace for deeper economic downturn with trump

XAUUSD Entry on break of structure ?Hello traders, this is a complete multiple timeframe analysis of this pair. We see could find significant trading opportunities as per analysis upon price action confirmation we may take this trade. Smash the like button if you find value in this analysis and drop a comment if you have any questions or let me know which pair to cover in my next analysis.

GOLD surges to weekly targets, eyes era levelsSpot gold prices have surged on the back of US President Trump’s tariff announcement. Gold prices rose as much as 3.9% on Wednesday as markets were volatile, before closing up 3.4%. At the time of writing today, Thursday (April 10), gold is up as much as $44, or 1.4%, on the day.
Gold prices posted their biggest one-day gain in 18 months on Wednesday as confusion over US President Donald Trump’s tariff agenda prompted investors to buy the precious metal as a safe-haven asset, Bloomberg reported.
But after China announced plans to retaliate with 84% tariffs on US products starting Thursday, Trump immediately raised tariffs on China to 125%. The moves raised concerns that the world's two largest economies were heading toward a full-blown trade war.
Stock markets rallied after Trump announced the tariff suspension. US stocks had their best day since the financial crisis, with the S&P 500 index rising nearly 10% after falling to the brink of a bear market last week.
Bloomberg said the US government's erratic tax plans have shaken the world as investors look for direction and certainty. That has supported gold prices overall, with prices up 18% this year. Expectations of further monetary easing by the Federal Reserve and central bank gold purchases have also boosted prices.
Gold has gained more than $400 this year, hitting an all-time record of $3,167.57 an ounce on April 3.
Minutes from the Federal Reserve's March meeting showed policymakers almost unanimously warned last month that the U.S. economy faces the risk of rising inflation while economic growth slows. Some policymakers noted that there could be "difficult trade-offs" ahead.
According to CME Group's FedWatch tool, traders see a 72% chance that the Fed will cut interest rates in June. Gold itself does not generate interest rates, and will perform well in a low-interest-rate environment.
Investors are now looking to the U.S. consumer price index (CPI) due out today (Thursday) for further trading information.
Technical outlook analysis OANDA:XAUUSD
On the daily chart, gold surged to hit all the weekly upside targets noted and readers in the weekly publication at $3,056 in the short term and then the full price point of $3,100. Looking ahead, gold only has a $3,150 size creature to break to set a new all-time high or more.
The relative strength index (RSI) is building, signaling bullish energy in the near term, as long as gold remains in the price channel, the declines should only be limited corrections and not a trend.
As we have noted to our readers throughout our articles since Trump returned to the White House, dips can be viewed as buying opportunities.
And for the day, the notable positions for the bullish picture on the technical chart of gold will be listed again as follows.
Support: 3,103 – 3,100 – 3,056 USD
Resistance: 3,150 – 3,167 USD
SELL XAUUSD PRICE 3192 - 3190⚡️
↠↠ Stoploss 3196
→Take Profit 1 3184
↨
→Take Profit 2 3178
BUY XAUUSD PRICE 3050 - 3052⚡️
↠↠ Stoploss 3046
→Take Profit 1 3058
↨
→Take Profit 2 3064
Will gold fall after its strong rise?From a technical perspective, if gold breaks through 3054 this week, the next major resistance level will be in the 3100 USD area. We need to pay special attention to this position on Thursday and Friday, as it is a key dividing line between long and short positions. If this position can be re-established this week, the upper side may test the historical high target again. At present, the downward momentum of gold has basically weakened compared with last week. If you want to operate, you can pay attention to the support near 3053. Before breaking through, any decline is a long opportunity. The upper pressure will first look at the competition near 3100. If it stands above, you can try to chase more aggressively. On the whole, the short-term operation strategy for gold is to short on rebounds and to buy on pullbacks. The upper short-term focus is on the 3095-3100 resistance line, and the lower short-term focus is on the 3035-3040 support line.
Gold operation strategy reference:
Short order strategy: Short gold rebounds near 3095-3098 in batches, stop loss 6 points, target near 3070-3050, break to see 3035 line;
Long order strategy: Long gold pullback near 3035-3038 in batches, stop loss 6 points, target near 3055-3065, break to see 3075 line;

Gold sold!!I’m bearish on Gold for the rest of the week, maybe into Monday.
Entry: 3330
Stop Loss : 3357
Take Profit : 3230
