Gold prices soared again!Market news:
In the early Asian session on Wednesday, spot gold suddenly surged in the short term, breaking through the $3,275/ounce mark, with an intraday increase of more than $45. The latest report from Bloomberg News in the United States said that as the Trump administration pushed forward investigations that could expand the trade war, it stimulated demand for safe-haven assets, and the London gold price hit a record high again. As the escalating trade war has raised concerns about the prospect of a global recession, as a traditional safe-haven asset, gold has accumulated a gain of more than 23% in 2025, continuing to set a record. As investors increase their holdings of international gold-backed exchange-traded funds (ETFs) and central banks continue to increase their holdings of gold, major banks remain optimistic about the outlook for gold in the coming quarters. Investors are waiting for a speech by Federal Reserve Chairman Powell, scheduled for Wednesday, to look for clues related to interest rates. It is also necessary to pay attention to the US retail sales data at 20:30 on Wednesday and the specific implementation details of Trump's tariff policy. The analyst specifically reminded that market liquidity may decline before the Good Friday holiday, and any sudden policy changes may trigger sharp fluctuations.
Technical Review:
Gold opened sharply higher in the early trading and hit a new record high. It broke through the 3230 mark in the late trading and stabilized. The price continued to break the adjustment range of yesterday and rose in large volume. There was no technical movement during the day. The super-gain appeared in the early trading, and the price continued to hit a new record high. As investors turned to safe-haven assets amid the uncertainty brought by the continued tariff plan of US President Trump, additional tariffs could exacerbate the ongoing trade war and slow global economic growth. As global stock markets bottomed, the pressure on gold finally eased, and the precious metal rose sharply to a record high. The rise was very fierce because everyone rushed into the gold market, hoping to use it as a safe haven against the stagflation caused by the trade war. From a more macro perspective, gold is still in an upward trend because real yields may continue to fall because the threshold for rate hikes remains very high. Potential risks include another sharp sell-off in the stock market or a hawkish stance from the Federal Reserve. In the short term, given that gold's buying positions are too concentrated, if the trade war eases, gold prices are likely to experience a deeper correction, so it is necessary to pay close attention to developments in this regard. The current environment still supports the rise of gold, but the road to gold price rise will not be smooth, and there may be a temporary correction in the middle.
Today's analysis:
Gold directly broke through the new high in the early trading to avoid risks. The short-term adjustment of gold ended and finally completed the adjustment in a volatile manner. This kind of strong buying market of the breakthrough will basically not fall back too much. Since gold has chosen to break upward, since it has broken through, then it is to buy in the trend. The decline of gold is an opportunity to buy.The 1-hour moving average of gold began to turn upward. If the 1-hour moving average of gold continues to diverge upward, then the buying of gold will continue to exert its strength. After gold breaks through 3245, then gold 3245 has formed support in the short term. Buy on dips when gold falls back to 3245. The strength of the wave of gold in the morning was still there at that time, so after the high, you must wait patiently for adjustments and continue to go long. Gold can continue to buy when it falls back to around 3245.
Operation ideas:
Buy short-term gold at 3245-3248, stop loss at 3236, target at 3280-3290;
Sell short-term gold at 3293-3295, stop loss at 3304, target at 3250-3240;
Key points:
First support level: 3253, second support level: 3240, third support level: 3225
First resistance level: 3280, second resistance level: 3300, third resistance level: 3315
USCGC trade ideas

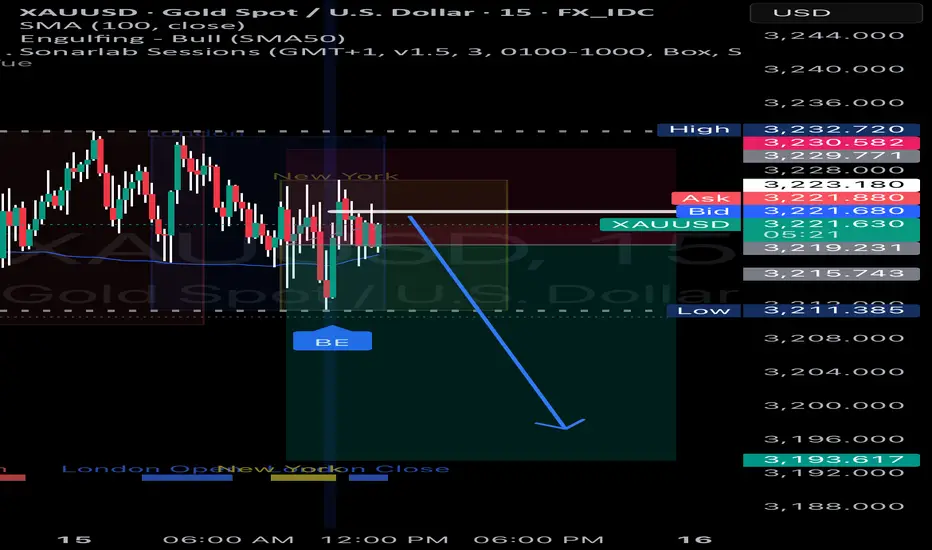
XAU SELLS incoming LOW Risk SellsAs Tariffs and trade wars lighten up from the past weeks. Tensions remain yet are much less than the past 2 weeks.
This signals a correction on Gold from its current all time highs.
Simply looking for a pullback to the 3,193 area as TP
SL - 3,230.5
XAUUSD SET TO TRADE UPTO $3330 (261.8 FIBO LEVEL)Price is set to make another bullish move upto $3330 per ounce. This comes after we have an impulsive bullish movement which confirms the readiness of buyers to take price higher from the current price. A buy opportunity is envisaged from the current market price

GOLD - FEAR has switch to GOLDTeam, gold has been pumped non-stop on fearing trump tariff
But the current price indicates a double top
We expect the falling range around 3260 to 3215
current price is 3272 - if stop loss at 3285
Once the price hits 3265, bring the stop loss to BE and target a further range.
We do not often trade gold only sometimes.

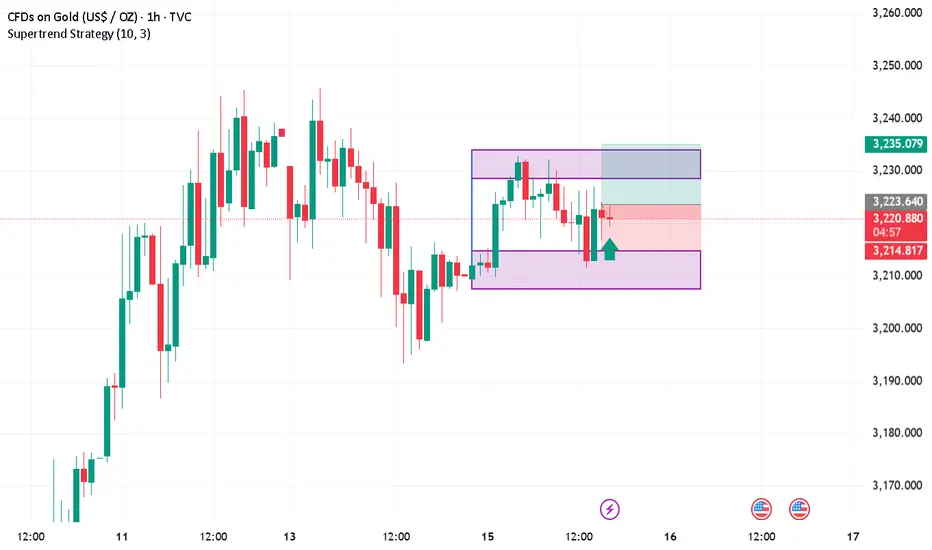
XAUUSD Entre point 3222 Target 3232 Stop loss 3214XAUUSD Trade:
Buy Signal:
Entry: 3222
Target: 3232 (+10 pips)
Stop Loss: 3214 (large stop)
Let's monitor the trade! Potential for gains!
Will Gold Retest 3170 ATHs in Sight Amid Rising Global TensionsXAU/USD has decisively broken above the significant 3170 resistance level, confirming bullish momentum and signaling a potential continuation of its long-term uptrend. This breakout is not just technical—it's backed by a growing fundamental storm.
With escalating geopolitical tensions, the ongoing trade war rhetoric surrounding Trump’s tariff policies, and persistent global macro uncertainty, gold is once again asserting its role as a premier safe haven asset. These drivers are creating the perfect backdrop for further upside, possibly pushing gold toward new all-time highs.
Currently, price is in a healthy correction phase, pulling back toward the former resistance zone at 3170, which now acts as strong support. A retest and confirmation in this area may offer a high-probability long setup for trend-followers and breakout traders alike.

Sizable fall possible... Starting todayNothing much to describe.
Everything on chart.
Best selling zone 3227-3236
Stop (approx) 3245-48
Expecting 3182-3168-60
And much more in coming days... May be 2880/60
Posting hourly chart.

SELL XAUUSDI am BEARISH on GOLD to 3150.
Gold will make a retracement to the recent significant resistance.
Price action on Hourly Chart is actually showing a build up of momentum to retrace.
Fundamentals could nullify, but I am afraid to buy.
The trend is up though.

XAU/USD Price Action Update – April 15, 2025📊XAU/USD Price Action Update – April 15, 2025🎯
🔹Current Price: 3,226.455
🔹Timeframe: 30M
📌Key Support Levels (Demand Zones):
🟢3206–3209 – Minor Demand Zone
🟢3187–3197 – Intermediate Demand Zone (Wait for Confirmation)
🟢3150–3167 – Major Demand Zone (Wait for Confirmation)
📌Key Resistance Levels (Supply Zones):
🔴3243.637 – Current Resistance (Marked on Chart)
🔴3250.861 – Major Resistance
📈Bullish Scenario:
Price broke above the 3206–3209 zone and is now climbing. If bullish momentum continues, we might test 3243.637 and potentially 3250.861. A clean breakout and close above 3250.861 could open the door to new highs.
📉Bearish Scenario:
Failure to break above resistance or a bearish engulfing at 3243.637/3250.861 can push the price back to retest 3206–3209 or deeper into 3187–3197. Wait for confirmations before entering shorts.
⚡Trading Tip:
✅Wait for confirmation candles (e.g., bearish engulfing or rejection wicks) before entering any shorts at resistance zones.
✅Look for strong bullish price action or order block reaction at demand zones for potential long entries.
✅Always use proper risk management and a favorable risk-reward ratio.
#XAUUSD #GoldAnalysis #ForexTrading #PriceAction #TechnicalAnalysis #SmartMoneyConcepts #SupplyAndDemand #IntradayTrading #ScalpingSetup #GoldBulls #GoldBears #LiquiditySweep #BreakoutStrategy #MarketStructure #FVG #FXFOREVER

Gold trading zones: 15-APRIL-2025Today's Gold trading zones: A starting point for your market analysis.

gold ; Is it time to move up or down? In the short term, of courGood day: My friends, this is my mind in the short and medium term for trading. This is just a theory, not a buy or sell signal.

Gold: It may Fall below 3180 todayOver the weekend, Trump announced a pause on tariffs for popular consumer electronics, prompting gold to gap down to 3210 at today’s open;
✅ Our recommended short entries at 3230–3260 are already in profit;
New semiconductor tariff announcements are due during the U.S. session today — the key driver for gold’s next move;
Given the fragile U.S. political/economic backdrop, escalating tariff conflict is unlikely, increasing the chance of bearish impact on gold;
With gold already trading at a premium, any "tariff relief" narrative will likely trigger speculative sell-offs;
If you're holding short positions, consider being patient — avoid premature exits due to emotional reaction to minor pullbacks.
Maintain key short entry zone: 3230 – 3260;
Expect gold to test below 3180 if market sentiment shifts

Gold Market Outlook: Potential Pullback in Play Following Early Early this morning, the gold market opened with a downside gap, potentially signaling the beginning of a corrective phase. With no high-impact economic events on the calendar today, price action may remain sideways or retrace toward the previous session’s low. On the 1-hour timeframe, bearish divergence has already been identified, supporting the case for a short-term pullback.
A similar consolidation phase occurred after the bullish momentum seen from March 11 to March 20. If no unexpected developments influence the market, comparable price behavior could emerge. Overall, conditions suggest a classic breakout–pullback–continuation scenario, which is consistent with typical movements following strong directional trends. A key resistance zone near the 3280 level is currently being observed as a potential target area

the gold down as we expact before start to go upxauusd
enter=3195
TP1=3245
TP2=3363
TP3=3297
ST=3177

Daily Analysis: 14-04-2025Spot gold ended last week with a strong gain of 6.6%, closing at 3238 and recording a new all-time high at 3245. This morning, gold is witnessing profit-taking activity. These pullbacks are likely due to President Trump’s retreat from his previously hardline stance on tariffs, which boosted risk appetite and prompted some investors to take profits. On the other hand, the U.S. dollar continues to weaken.
In this context, as long as the 3200 support level is maintained, the 3260 resistance remains a potential target. However, if the 3200 support is broken, the levels of 3175 and 3150 may emerge as the next support zones.
GoldXAUUSD
- Consolidation Phase
- Break of Structure
- Ascending Triangle as an corrective pattern in short time frame
- Completed " 12345 " Impulsive Waves and " ABC " corrective pattern
- Falling Wedge in Short Time Frame

Gold market analysis: 14-APRIL-2025Happy New week, check out our Gold market analysis: Today's zones for strategic decision-making.

April 14, 2025 - XAUUSD GOLD Analysis and Potential OpportunitySummary:
Last week, gold continued to post new all-time highs, and the market was highly active. For short-term traders, both long and short setups provided profitable opportunities.
However, it’s important to respect the market and carefully evaluate every trade entry — especially after such a strong bullish run.
The previous high was 3245.5 — shorting near this level offers a favorable risk-reward. If the price breaks above and sets a new high, I’ll wait for a pullback before entering any new long positions.
Key Levels to Watch:
3250–3255: Bullish target zone
3246: ATH resistance
3234: Bullish/Bearish pivot line
3228: Support
3218: Key intraday support
3210: Final bullish defense
3088: Major historical support
Short-Term (15m) Strategy:
For Shorts: Enter a SELL if the price breaks below 3237. Watch 3234 first; if the decline continues, monitor 3230, 3228, and 3224.
For Longs: Enter a BUY if the price holds above 3246. Watch 3250 for confirmation; if bullish momentum continues, target 3255, 3260, and 3265.
👉 If my insights have been helpful to you, or if you traded based on my ideas, please consider giving a like — it’s a great encouragement for me! Thanks for your support!
Disclaimer: This is my personal opinion and not financial advice. Please manage your risk accordingly.

XAUUSD/GOLD Long 1:2XAUUSD/GOLD Long 1:2
Looks good long, gold is strong.
Hey, be careful, its GOLD not some easy instrument.
Use proper risk management
Looks like good trade.
Lets monitor.
Use proper risk management.
Disclaimer: only idea, not advice

Gold price should retrace to its liquidity zone of 3120Gold price should retrace to its liquidity zone of 3120

Long towards 3244.00 area a quick one.Expecting Gold to push towards 3244 area... it will be a very quick one immediate the market opens.

How Momentum Divergence Reveals Hidden Market Strength and WeaknMost traders watch price action closely: candlesticks, moving averages, trendlines. But there’s a deeper, less obvious layer of information that often signals shifts in direction before price confirms it: momentum.
📌 Quick overview – what you'll learn:
What momentum divergence is (clearly explained)
How it helps predict potential trend shifts
Practical ways to spot and trade divergences
📈 Price vs Momentum: They're Not the Same!
Momentum doesn't simply track price direction. Instead, it measures the strength behind price movements.
Rising prices, falling momentum often signals upcoming bearish reversals.
Falling prices, rising momentum often hints at bullish reversals building beneath the surface.
These subtle divergences are powerful because they reveal hidden market shifts before everyone else notices them.
⚠️ How to Spot Momentum Divergence (Simple Steps):
Step-by-step:
- Find clear price swings:
Clearly defined highs/lows on your chart.
- Check momentum indicators (RSI, MACD, CCI, etc.):
Does the indicator agree or disagree with the price action?
- Spot divergence:
Bullish divergence: Price makes lower lows, indicator shows higher lows.
Bearish divergence: Price makes higher highs, indicator shows lower highs.
- Confirmation:
Always wait for price confirmation like a reversal candle or break of a trendline.
🔥 Why Momentum Divergence Works:
Divergence highlights hidden accumulation or distribution by smart money.
Helps you anticipate reversals before price confirms.
Filters out weak moves and helps you avoid fake breakouts.
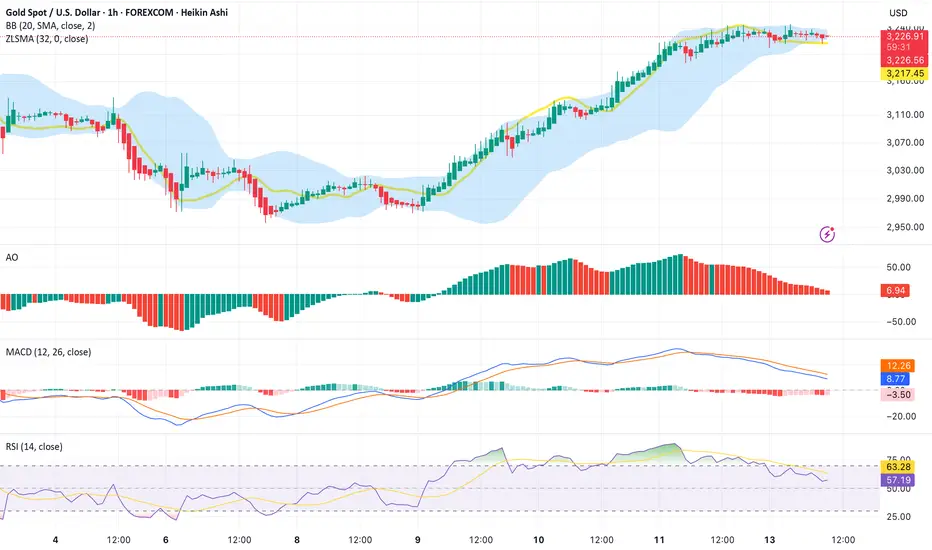
📊 Real Example (XAUUSD – April 2025):
Recently in Gold:
Price was dropping steadily, reaching new lows.
Meanwhile, RSI showed clear higher lows – classic bullish divergence.
Result: Price exploded significantly shortly after momentum divergence appeared clearly.
🧠 Trading Tips to Remember:
Divergence signals are stronger near key support/resistance zones.
Use momentum divergence with your existing strategy for confirmation, not isolation.
Always define your risk clearly (set stops above/below recent highs/lows).
🚩 Common Pitfalls to Avoid:
Trading divergence without confirmation: always wait for the market to show its hand.
Ignoring the bigger picture: check higher timeframes for stronger signals.
Overtrading: not every divergence leads to a reversal; quality beats quantity.
🚀 Your Action Plan for Next Week:
Pick one momentum indicator and identify at least 3 divergences on your favorite assets.
Monitor how they play out.
Note down what works best in your trading journal.
💬 Question for you:
What’s your go-to momentum indicator when spotting divergence? RSI, MACD, CCI, or something else? Drop a comment below!
Happy trading!
TrendGo Team

The price of gold will reverse!As predicted, we expected a 5-wave formation, which happened, and with the formation of a divergence between waves 3 and 5, the price of gold fell.
Now a small wave with 5 parts has formed, which could be wave A of a zigzag.
We expect the price to grow by 61.8% of the decline that occurred in the main wave B.
Now, considering the psychological support of $3,000, this price reversal may happen right now or it may fall to the $2,960 range and then the price will grow.
In general, we will have a growth in the main wave B and then another sharp decline in the main wave C.
Meanwhile, the RSI indicator has also reached the oversold limit.
Good luck and be profitable.
