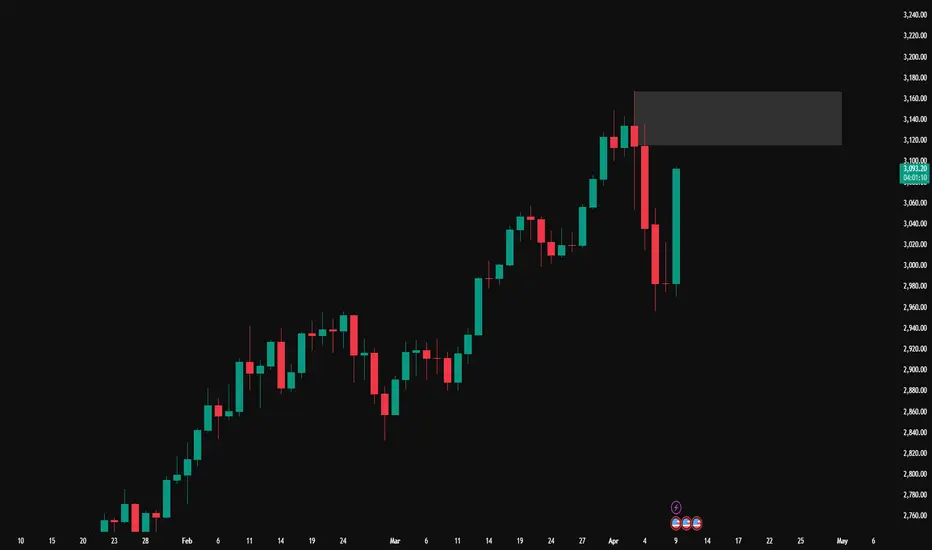
XAU/USD Technical Outlook – April 10, 2025XAU/USD Technical Outlook – April 10, 2025 🟡
🔹 Current Price: $3,121.94
🔹 Timeframe: 15-Minute Chart
📌 Key Demand Zones:
🟩 3089–3098 – Nearest bullish continuation zone
🟩 3048–3052 – Deeper demand, potential reversal if retested
📌 Key Supply Zones:
🟥 3143–3149 – Minor resistance
🟥 3162–3168 – Major supply zone, strong rejection expected
📈 Bias: Bullish until a break below 3089
🛠️ Strategy:
Monitor for bullish confirmations at 3089–3098 zone for long entries
Watch for bearish price action at 3143+ for potential short scalps
#XAUUSD #GoldAnalysis #SmartMoneyConcepts #SupplyAndDemand #FXFOREVER #IntradayTrading
USCGC trade ideas

Gold ShortPotential short opportunity on gold.
- plenty of supply highlighted in the circles
- retracted off 4hr SR line
- retracted off downwards Trendline
- the overall trend is bullish if you look in the daily/weekly chart, but always expect a pullback

XAUUSD big fall incoming?
OANDA:XAUUSD
The price has gone crazy today. I haven't seen a daily candle like this in a long time. I will be looking to short the market, since I still stand with the statement that on Trumps' tariffs plan, and we can also see a supply zone on a daily timeframe, although I've heard that the federal reserve will cut rates, meaning bearish TVC:DXY therefore bullish for OANDA:XAUUSD . There is also an FOMC meeting today, so I will keep an eye on the decision and change of policies.
Anyone short? Any thoughts?

Gold Technicals & FundamentalsCurrent Price: $3,043
Resistance Zone: ~$3,041–$3,045 (major historical level)
Indicators: Bollinger Bands (BB 20, 2)
🔍 Key Observations:
1. Major Resistance Hit
Price has aggressively rallied to test major resistance (previous support-turned-resistance).
There's a sharp rejection or hesitation zone marked by a large red arrow — suggesting a possible reversal or consolidation.
2. Bollinger Band Squeeze/Breakout
Price is hugging the upper Bollinger Band, showing high momentum.
However, when price rides the upper band for too long without volume continuation, it may snap back to the mean (20-SMA), which lies around $3,002.
3. Potential Scenarios:
📉 Scenario 1: Rejection
If price fails to break and hold above $3,045:
Expect a pullback to $3,020–$3,010 and possibly to $3,002.
Bearish confirmation would be a strong red candle with volume near resistance.
📈 Scenario 2: Bullish Breakout
If the price consolidates above $3,045, especially with a breakout candle:
We could see a rally to $3,065 and then $3,080+.
Look for volume confirmation and retest of resistance as support.
📰 Fundamental Factors to Watch (April 9, 2025):
🔴 High-Impact Events Today:
US CPI Inflation Data – Scheduled Today
🔥 Biggest mover for gold, forex, and indices.
If inflation is hotter than expected: 🡆 Hawkish Fed 🡆 Dollar up 🡆 Gold down
If inflation cools: 🡆 Dovish Fed 🡆 Dollar down 🡆 Gold up
FOMC Member Speeches / Fed Outlook
Hawkish tone = bearish for gold.
Dovish tone = bullish for gold.
Bond Yields & DXY (US Dollar Index)
Gold has a strong inverse correlation with both.
Rising yields or a stronger dollar will likely pressure gold downward.
⚠️ Trading Sentiment Summary:
"Gold is either going to knock down that resistance door or bounce off it like a kid running into a screen door in summer. Today’s CPI data will decide if it’s flying high or face-planting back to $3,000."

Gold Next Move...The price might fall to the yellow EMA around 2,940 - 2,900. If it holds, we could see a bounce from that level.

Gold trend under panicRecently, gold price fluctuations have significantly increased, and the decline in risk appetite in the global financial market has driven funds to safe-haven assets. As various assets are sold off, although gold has shown resistance to declines, it has frequently experienced violent fluctuations during the trading session - a rapid rebound after a sharp drop has become the norm, and the daily fluctuation often reaches more than 20 US dollars. The current market environment is complex, with geopolitical situations, economic data and emotional games intertwined. The main funds are taking advantage of the situation to wash the market, and the difficulty of short-term trading has increased.
From a technical point of view, the gold price is in a short-term range shock pattern, with upper resistance at 3025-3030 and lower support at 2972-2963. The key defense line of 2963 cannot be lost. If it falls below this position, it may trigger further downside risks. Strategically, it is recommended to adopt the idea of "high-altitude and low-multiple": try short with a light position when approaching the resistance level, short-term long after stepping back to the support level and stabilizing, and strictly set stop losses to prevent extreme fluctuations. It is worth noting that if the price effectively breaks through 3055, it means that the previous adjustment has ended, and the subsequent upward trend may restart.
Gold strategy: Buy when it falls back to around 2980-2975, target 3005

XAUUSD technical analysis.XAUUSD technical analysis next move possible at h1 time.not financial advise.

XAU going to drop market structure shift and choch happened and market take the idm and now making liquidity for the target partily book profit extram poi is 2850

NY Session Gold Bullish trade ideaLooking at going long from the marked zones. Let's see how it plays out.

Gold: Watching for a Correction After Five-Wave DeclineOn the 1H timeframe, Gold appears to have formed a five-wave structure downward . At this stage, I expect a corrective upward movement , possibly taking the form of a Zigzag (ABC)—though the actual shape of the correction remains uncertain. It’s important to approach the market with probabilistic thinking rather than trying to predict exact outcomes. Let price action guide your decisions.
Key correction zones to watch:
• Previous wave 4 area: ~3031
• Fibonacci retracement zone (50–61.8%): ~3063–3088
Only after the correction structure is complete—and confirmed—will it be reasonable to consider short positions , with a potential target near 2860 .
Stay flexible and reactive, the market leads, and we follow.

GOLD BEARS ARE STRONG HERE|SHORT
GOLD SIGNAL
Trade Direction: short
Entry Level: 3,132.31
Target Level: 3,059.08
Stop Loss: 3,180.97
RISK PROFILE
Risk level: medium
Suggested risk: 1%
Timeframe: 5h
Disclosure: I am part of Trade Nation's Influencer program and receive a monthly fee for using their TradingView charts in my analysis.
✅LIKE AND COMMENT MY IDEAS✅

Gold trading zones: 08-APRIL-2025Today’s Gold trading zones: For educational purposes only, use at your own risk.

It could be worse for Gold and Bitcoin, right? Apple alone has shed nearly $640 billion in market capitalisation over just three days. The S&P 500 has fallen more than 10% during the same stretch—its worst performance since the onset of the COVID-19 pandemic. In Asia, the selloff is even more severe, with Japan's Nikkei 225 down nearly 8%, South Korea’s Kospi 200 off almost 6%, and Taiwan equities falling close to 10%, triggering circuit breakers.
In comparison, Bitcoin and Gold, while under pressure, appear to be weathering the downturn with relatively less panic.
Bitcoin has declined around 10%—a notable drop, but not unusual by crypto standards. Trading near $76,000, it has returned to pre-election levels, breaching both short- and long-term support zones.
Gold is tracking its worst three-day performance in over four years. Although some positive forecasts are emerging. Deutsche Bank has revised its year-end gold price forecast upward to $3,350, citing rising recession risks and renewed safe-haven demand.

Weekly Open: Gold Market Eyes Bullish BreakoutGold market opens with a fresh weekly formation as price was mitigated at the 2970's during the Asian session. This paves the way for a bullish projection build-up. Now, all eyes are on the channel—if broken across 3060's, it may confirm a grand bullish sentiment shift. follow for more insights , comment for more, as well boost idea

Intraday Gold Idea 07/04/2025Gold (XAUUSD)
Price has moved nearly 900 pips so far today with huge volatility. While the daily and higher timeframes remain bullish, lower timeframes show a bearish pullback after rejecting 3053.
Bearish path: Targeting 3005–2998 if the pullback continues.
Bullish path: A break/retest above 3053 opens 3087 as next target.
No catalyst? We may see deeper pullbacks, even down to 2932.
Bias: Bullish overall, but wait for key level confirmations. Don’t get chopped up—trade clean setups only.

Gold Breakdown Accelerates: Key Support at 2950The daily chart for gold shows the Relative Strength Index (RSI) pulling back from near 80 (hit on Thursday) toward 50, suggesting that the recent drop is more than just a technical correction. Today’s opening saw gold gap down and extend Friday’s decline, raising the question: Will the daily chart see consecutive down days? The lower highs in the price structure indicate that after hitting the three-point resistance zone, a secondary bearish reversal could easily form, leading to further downside.
On the daily timeframe, gold has seen a sharp decline, with price now breaking below the short-term moving averages (MAs). These MAs are also starting to turn downward, signaling weakening momentum. Key support to watch is around 2950.
On the 4-hour chart, price has broken below the previous consolidation support zone, with candles consistently suppressed by short-term MAs, maintaining a strong bearish bias. Intraday, we’ll watch for any corrective rebound followed by a secondary decline. Short-term resistance sits near 3015.
After an early dip and minor rebound, lower timeframes show slight short-term strength, but the broader 4-hour downtrend resistance remains intact. Any bounce is merely a retest—if resistance holds, the downtrend will resume.

Daily Analysis- XAUUSD (Monday, 7th April 2024)Bias: Bullish
USD News(Red Folder):
-None
Analysis:
-Super volatile market
-Looking for continuation of bullish momentum
-Potential BUY if there's confirmation on lower timeframe
-Pivot point: 2960
Disclaimer:
This analysis is from a personal point of view, always conduct on your own research before making any trading decisions as the analysis do not guarantee complete accuracy.

Gold’s Breakout Setup: Will This Channel Fakeout Fuel the Surge?Gold’s recent false break of the channel might be nearing its end as bullish momentum builds. While higher timeframes suggest more room to run, a bounce around the 3000 level could be the next key move. Two bullish scenarios are in play: either we see a breakout to new highs or price consolidates in the new lower timeframe range before launching higher. Here's what traders should watch next.

XAU/USD (Gold) Analysis📌 Gold prices have experienced volatility following the announcement and implementation of President Trump's new tariff policies. Initially, gold surged to a record high of $3,148.88 per ounce as investors sought safe-haven assets amid escalating trade tensions. However, subsequent market reactions, including stock market sell-offs and profit-taking activities, have led to a retreat in gold prices.
🔑 Key Levels:
-Resistance: $3,056.09 ❌
-Support: $3,002.63 ✅ (if broken, next support at $2,954.46)
📈 Market Scenarios:
Bullish: If gold holds above $3,002.63 and breaks through $3,056.09, it could signal a continuation of the uptrend. 🚀
Bearish: A sustained move below $3,002.63 may indicate further downside towards $2,954.46. 📉
📘 This analysis is for informational purposes only and does not constitute financial advice. Always conduct your own research and consult with a professional before making trading decisions.

How to Set Stop LossesViolating stop losses is like alcoholism.
There are 3 basic ways to set stop losses in trading:
1. Price-Based Stop
This can be a fixed monetary or percentage loss.
This is the most common and comfortable method — trading becomes a game with predictable outcomes. Knowing your maximum risk keeps emotions in check.
How to choose the price level?
Set a loss limit you're comfortable with — for example, 1% for a short-term trade or up to 12% for an investment position.
I don’t recommend anything over 15% — that usually signals a bad position that starts draining your energy and dominates your thoughts: “When will this finally recover?!”
Alternatively, use a support/resistance level, previous high/low — but don’t place the stop exactly on the level. Put it slightly above/below (e.g. 0.5%) and make sure the potential loss is still acceptable.
Or base it on volatility — for example, the Volatility Stop indicator on TradingView. Again, place your stop slightly beyond the indicated level.
Avoid setting stops based on moving averages — they’re trend indicators, not stop-loss tools.
2. Indicator-Based Stop
Used when a price breaks a key technical level or indicator signal — useful in trend or pattern-based strategies.
3. Time-Based Stop
Often used around news events or major announcements. The market needs time to digest the info, so a time stop lets you exit if the move doesn’t happen within a set timeframe.
❗️Match your stop-loss to the timeframe of your entry❗️
If you entered based on the daily chart — use daily levels, volatility, and context for your stop. Don’t mix timeframes.

short 3145 with 2tp legit 3005 after trump tlk abou tarifffor me its clear here.
its a classic buy the rumour sell the news
so when Trump will talk about tariff psssssss it will back down a lot
also it go far up so fast and a legit good correction is welcome
also high price made many as electronic and other goods ewpansive

Waiting for Monday Positions XAU-USDAfter big Down again sell off start but need pull back small so setup ready just waiting for price moments.
