Gold (XAUUSD) — Technical and Fundamental Analysis 2HTechnical Outlook
On the 4H chart, gold is forming a rising structure and is currently trading near the 3236–3260 resistance zone, aligned with the 1.272 Fibonacci extension. This area is expected to act as a short-term cap, with a potential corrective move ahead.
🔹 Key Levels:
Resistance: 3236, 3260
Support: 3132–3140 (trendline), 3082 (horizontal zone)
🔹 Formations:
Potential retracement setup after an extended impulse
Expected correction toward 3132–3140 (rising trendline)
If support holds, price may resume the uptrend toward 3308 (1.414 Fibonacci extension)
🔹 Indicators:
RSI near overbought zone
MACD shows momentum weakening
EMA 50/200 continue to support the bullish trend
Fundamental Drivers
Inflation concerns and soft landing expectations support safe-haven flows
Market is pricing in potential Fed rate cuts in H2 2025
Central banks continue to accumulate gold reserves
Dollar weakness provides additional support for gold prices
Scenario
Base case:
Rejection at 3236–3260 → pullback to 3132–3140 → continuation toward 3308
Alternative:
Break above 3260 → direct move to 3308.
Break below 3132 → possible slide toward 3082.
USCGC trade ideas

GOLD H1 Pro Levels Chart Update by FMPIn this chart you will find trend continuation levels of gold including psychological levels, blind structure levels with 3080 sequences

Gold & Silver Soar: Trade War RallyAnatomy of a Rally: How US-China Trade Tensions Propelled Gold to Record Highs and Lifted Silver
Introduction
The global financial landscape is frequently reshaped by geopolitical events, and few have cast as long a shadow in recent memory as the trade tensions between the United States and China. During periods of heightened friction, characterized by escalating tariffs, retaliatory measures, and pervasive economic uncertainty, markets often witness significant shifts in asset allocation. One of the most prominent beneficiaries during such times is gold. This document explores the dynamics behind gold prices reaching record highs amidst a US-China trade war, examining the multifaceted reasons for its ascent and noting the concurrent, significant rise in silver prices, which often move in tandem with the yellow metal due to overlapping market drivers.
The US-China Trade War: A Catalyst for Uncertainty
The trade conflict between the world's two largest economies represents more than just a dispute over tariffs and trade balances. It embodies a fundamental clash over technology, intellectual property, global influence, and differing economic models. The imposition of tariffs on hundreds of billions of dollars worth of goods creates direct economic consequences:
1. Increased Costs: Businesses face higher import costs, which can be absorbed (reducing profits), passed onto consumers (potentially fueling inflation), or lead to shifts in supply chains (causing disruption and inefficiency).
2. Reduced Trade Flows: Tariffs act as barriers, potentially dampening global trade volumes and impacting export-oriented economies.
3. Economic Growth Concerns: The uncertainty surrounding future trade policies makes businesses hesitant to invest and expand, potentially leading to slower global economic growth or even recessionary fears.
4. Supply Chain Disruptions: Companies reliant on cross-border supply chains face significant operational challenges, needing to find alternative suppliers or routes, often at higher costs and lower efficiency.
5. Currency Volatility: Trade disputes can lead to fluctuations in exchange rates, particularly involving the US dollar and the Chinese yuan, adding another layer of risk for international businesses and investors.
This pervasive uncertainty becomes a powerful driver pushing investors towards assets perceived as safe.
Gold: The Quintessential Safe Haven
Gold's reputation as a safe-haven asset is deeply ingrained in financial history. During times of economic stress, political instability, or market turmoil, investors flock to gold for several key reasons, all amplified by a US-China trade war:
1. Store of Value: Unlike fiat currencies, which can be devalued by inflation or government policy, gold is seen as retaining its intrinsic value over the long term. Fears that trade wars could lead to competitive currency devaluations or necessitate inflationary monetary policies (like extensive quantitative easing) make gold particularly attractive.
2. Hedging Against Uncertainty: When the outlook for traditional assets like stocks and bonds becomes cloudy due to geopolitical risks like a trade war, gold offers a perceived refuge. Its price often exhibits a low or negative correlation to equity markets during downturns, making it valuable for portfolio diversification.
3. Geopolitical Risk Premium: Major international conflicts or tensions invariably add a risk premium to gold prices. A trade war between global superpowers significantly elevates perceived geopolitical risk, prompting safe-haven buying.
4. Weakening US Dollar Potential: While the US dollar itself can act as a safe haven, a protracted trade war could raise questions about the US economic outlook or lead to policies aimed at weakening the dollar to boost exports. Since gold is typically priced in US dollars globally, a weaker dollar generally makes gold cheaper for holders of other currencies, potentially increasing demand and pushing the dollar price higher.
5. Central Bank Demand: In an environment of heightened geopolitical tension and questions surrounding the dominance of the US dollar, central banks (particularly those in emerging markets or nations seeking to reduce reliance on the USD) often increase their gold reserves. This diversification strategy provides a steady source of demand, underpinning prices. A US-China trade conflict could accelerate this trend among various nations.
6.
The Mechanics of the Price Surge
The record high in gold prices isn't just a passive reaction; it's driven by active market dynamics:
• Increased Investor Demand: Retail and institutional investors increase allocations to gold through physical bullion, gold futures contracts, and gold-backed Exchange Traded Funds (ETFs). Large inflows into major gold ETFs are often a visible indicator of this heightened demand.
• Speculative Activity: Traders in the futures market anticipate further price increases driven by the ongoing trade tensions and safe-haven flows, adding upward momentum.
• Sentiment: Market psychology plays a crucial role. As prices rise and news headlines focus on the trade war and gold's rally, a positive feedback loop can emerge, drawing in more buyers afraid of missing out (FOMO).
Silver's Ascent: Riding Gold's Coattails and Its Own Merits
Silver prices registering a steep rise alongside gold during such a period is a common phenomenon, though its drivers are slightly more complex:
1. Monetary Asset Correlation: Silver, like gold, has a long history as a monetary metal and store of value. It often trades as "poor man's gold," attracting investors seeking safe-haven exposure at a lower price point per ounce. During strong gold rallies driven by macroeconomic fear, silver typically follows suit.
2. Industrial Demand Component: Unlike gold, silver has significant industrial applications (electronics, solar panels, medical devices). This is a double-edged sword during a trade war. While safe-haven demand pulls prices up, fears of a trade-war-induced global economic slowdown could theoretically dampen industrial demand, potentially capping silver's gains relative to gold. However, in scenarios where safe-haven buying dominates market sentiment, this factor often takes a backseat initially.
3. Higher Volatility: Silver markets are smaller and typically more volatile than gold markets. This means that significant inflows driven by safe-haven sentiment can lead to sharper percentage gains (and potentially sharper losses during corrections) compared to gold. The "steep rise" noted is characteristic of silver's higher beta.
4. Gold-Silver Ratio: Traders often watch the gold-silver ratio (the number of silver ounces needed to buy one ounce of gold). When this ratio reaches historical extremes, some investors may buy silver, betting that it is undervalued relative to gold and that the ratio will revert closer to its historical mean. A major gold rally can stretch this ratio, triggering such trades and boosting silver demand.
Global Trends and Context
While the US-China trade war serves as a potent catalyst, it often occurs within a broader context of global trends that can support precious metal prices. These might include accommodative monetary policies from major central banks (low interest rates reduce the opportunity cost of holding non-yielding assets like gold), existing geopolitical hotspots beyond the US-China relationship, concerns about sovereign debt levels, or nascent inflationary pressures. The trade war acts as an accelerant, amplifying the impact of these underlying factors on gold and silver.
Conclusion
The surge of gold prices to record highs during a period marked by an intense US-China trade war is a textbook example of the metal fulfilling its traditional role as a premier safe-haven asset. The conflict breeds deep economic uncertainty, stokes fears of currency devaluation, heightens geopolitical risk perception, and potentially influences central bank reserve policies – all factors that historically drive capital towards gold. The simultaneous sharp rise in silver prices underscores its strong correlation with gold as a monetary asset, benefiting from the same wave of risk aversion, albeit with the added complexity of its industrial demand profile. Understanding these dynamics is crucial for investors navigating volatile periods, highlighting gold's enduring appeal as a portfolio diversifier and a refuge when storm clouds gather over the global economy, particularly when sparked by friction between major world powers.
$GOLD - 5 digits in a few yearsGold could be a multibagger. Broke out of multiyear trendline resistance. I would buy any pullback

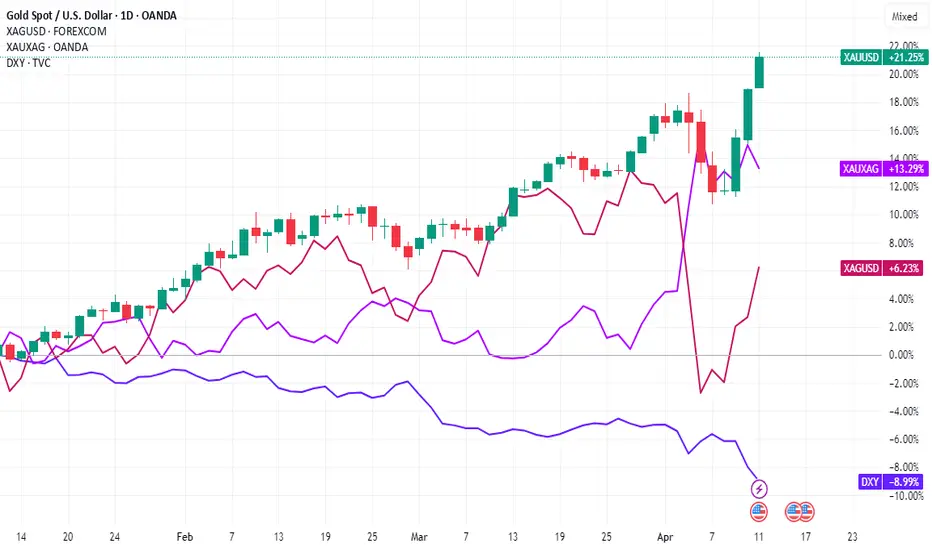
Gold’s deleveraging pullback spurs fresh demandSpot gold's initial response to the steepest US trade barriers in more than 100 years was a move to a fresh record high of USD 3,167 per troy ounce on heightened inflation risks, before surging volatility in response to collapsing stock markets saw traders turn their attention to capital preservation and deleveraging—the dash-for-cash focus hurt all leveraged positions across the commodities sector, including those in silver, which experienced a brutal 16.5% top-to-bottom slump, but also bullion, which despite its safe haven label during times of turmoil fell by around 4% before finding solid support around USD 2,950.
As the dust begins to settle following one of the worst risk reduction periods in recent years, demand for silver and especially gold has re-emerged, with gold has reaching a fresh all-time-high above USD 3,200, while silver has managed to retrace half of what was lost during the first week of April, both strongly suggesting that underlying concerns remain.
A combination of heightened global economic tensions, the risk of stagflation – a combination of lower employment, growth and rising inflation - a weaker dollar, will, in our opinion, continue to support bullion, and to a certain extent also silver. Adding to this is a market that is now aggressively positioning for the Fed to deliver more cuts this year—at current count more than 75 basis points of easing by year-end, and not least continued demand from central banks and high net worth individuals looking to reduce or hedge their exposure to US government bonds and the dollar.
With all the mentioned developments in mind, we maintain our forecast for gold reaching a minimum of USD 3,300 this year, while silver, given its industrious exposure and recession worries, may struggle to materially outperform gold as we had previously forecast. Instead, based on the XAU/XAG ratio returning below 90 from above 100 currently, we see silver eventually making it higher towards USD 37.

My Buying Area For Gold This strategy and module is Base on ICT and SMC advanced Level !
Keep Eyes on My levels !
Take 1% Risk

Gold trading zones: 11-APRIL-2025Daily Gold trading zones: Identifying potential opportunities for informed traders.

GOLD WEEKLY CHART MID/LONG RANGE ROUTE MAP UPDATEDWeekly GOLD Analysis: February 2024
Hello Traders,
Here’s a weekly chart analysis of the GOLD, offering a comprehensive view of recent market trends and future predictions. Our diligent tracking since October 2023 has consistently delivered 100% target accuracy, as evidenced by the marked Golden Circle areas on the charts. Let’s dive into the highlights and what lies ahead.
Recap of Recent Successes
Weekly Chart Highlights:
Last week, the market flawlessly followed our predictions:
* Key Level 2735 ✅ DONE
* Entry Level 2735.88 ✅ DONE
* EMA5: Crossed and locked above Entry ✅ 2735 DONE
* Bullish Target TP1: 2877 ✅ DONE
* The FVG zone around 2735 sustained bullish momentum, while resistance was broken, leading to a new all-time high of 2886.
What’s Next for GOLD? Bullish or Bearish?
We anticipate continued bullish momentum with updated GOLDTURN levels and refined targets.
Key Level: 2735 remains critical.
EMA5 Behavior:
* If EMA5 holds above 2735 and crosses/locks above TP1 (2877), the next target is TP2 (3018), followed by TP3 (3160).
* A failure to hold above 2735 could indicate bearish momentum, prices will be retesting support at 2595 in the demand zone.
Recommendations & Strategy:
* Focus on EMA5: Its behavior near 2735 and TP1 will provide clear direction for short- and long-term trades.
* Support Levels: GOLDTURN levels at 2735 and 2595 are critical for identifying reversal zones and optimal dip-buying opportunities.
* For precise entry and exit points, review our daily, 12H, 4H, and 1H analyses to navigate the market confidently.
* Slight pullbacks may occur, with potential reversals near GOLDTURN levels.
* Long-Term Outlook: The monthly chart suggests sustained bullish momentum, offering excellent opportunities for dip-buying near key support zones.
Stay Updated:
We’ll continue to share daily updates, insights, and strategies on our TradingView channel and YouTube channel every Sunday. Don’t forget to like, comment, and share to support our work and help others benefit!
The Quantum Trading Mastery

Is gold the only thing we have left?Logarithmic price scale with one and two standard deviation boundaries

Daily gold analysisDaily gold analysis
Sell trade with target and stop loss as shown in the chart
The trend is down and we may see more drop in the coming period in the medium term
All the best, I hope for your participation in the analysis, and for any inquiries, please send in the comments.
He gave a signal from the strongest areas of entry, special recommendations, with a success rate of 95%, for any inquiry or request for analysis, contact me


How I Lost -$500 On Gold......................In this video I explain how I took a lost of gold by simply not following my trading rules which resulted in a 500 dollar lost on my funded account

Gold selling plan!Wave 1 'Impulse Move' has moved very nicely to the downside & more is yet to come. So far the Wave 1 sell off has consisted of a 2,100 PIP move to the downside.
I'm now waiting on a Wave 2 correction of some sort, weather that's a 'Simple 3 Sub-Wave' or 'Complex 5 Sub-Wave' correction. During this correction I can enter more sell positions on behalf of my Gold Fund investors.


XAUSD SHORT IDEAPrice looks to be making another retest of H4 resistance zone of 3,025 - 3,035. On the H1 also approaching 50 EMA and resistance trendline. H1, H4 and the daily are bearish giving more reason for going short.

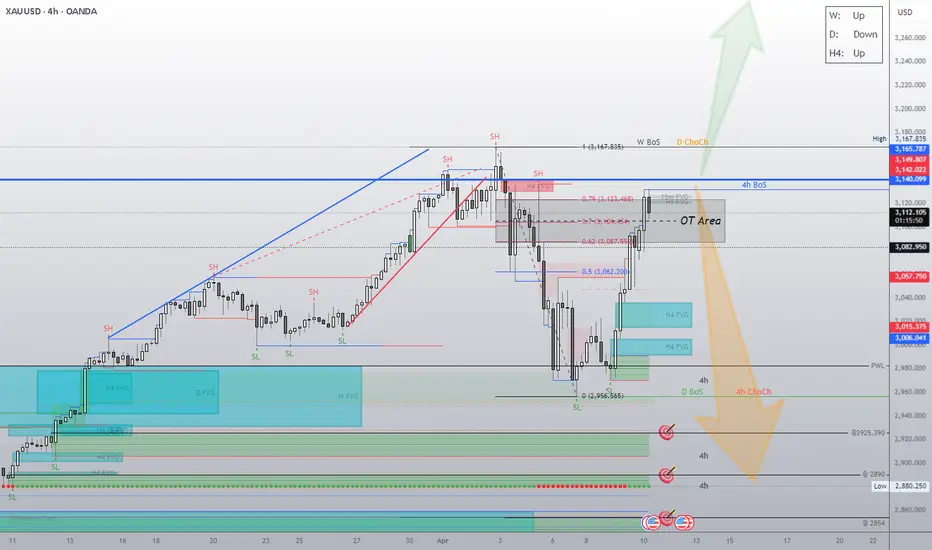
XAU/USD 08 April 2025 Intraday AnalysisH4 Analysis:
-> Swing: Bullish.
-> Internal: Bullish.
Analysis and bias remains the same as analysis dated 04 April 2025.
Since last analysis price has printed a bearish CHoCH which is the first indication, but not confirmation of bearish pullback phase initiation.
Price is now trading within an established internal range.
Intraday Expectation:
Price to trade down to either discount of internal 50% EQ, or H4 demand zone before targeting weak internal high priced at 3,187,835
Note:
With the Federal Reserve's dovish stance and persisting geopolitical uncertainties, heightened volatility in Gold is expected to continue. Traders should proceed with caution and adjust risk management strategies in this high-volatility environment.
Price could also be driven by President Trump's policies, geopolitical moves and economic decisions which are sparking uncertainty.
H4 Chart:
M15 Analysis:
-> Swing: Bullish.
-> Internal: Bearish.
Price has printed as per yesterday's analysis by targeting weak internal low and printing a bearish iBOS.
Price has subsequently printed a bullish CHoCH (I mentioned in yesterday's analysis bullish iBOS in error) indicating bullish phase initiation.
Price is now trading within an established internal range and appears to be stuck in between close supply and demand zones where we could see extended rangebound conditions.
Intraday Expectation:
Price to continue bullish, react at either premium of internal 50% EQ, or M15 supply zone before targeting weak internal low priced at 2,956.565
Note:
With the Federal Reserve maintaining a dovish stance and ongoing geopolitical tensions, volatility in Gold prices is expected to remain elevated. Traders should exercise caution, adjust risk management strategies, and stay prepared for potential price whipsaws in this high-volatility environment.
Trump's tariff announcement will most likely cause considerably increased volatility and whipsaws.
M15 Chart:

#GOLD Long Setup TP First ArrivedOur Buy Setup Hit our first Target 3015, let's wait For More Pump.. Book Some profit And Enjoy

1D TF MSSI’m noticing a clear market structure shift on the daily timeframe, which suggests that the market is likely to continue its bearish trend. This shift is confirmed by the break of a significant higher low, signaling that bearish momentum may be taking control and that we could see further downside movement.

Daily Analysis- XAUUSD (Tuesday, 8th April 2024)Bias: No Bias
USD News(Red Folder):
-None
Analysis:
-Strong bearish closure, price respected 0.618 fib level
-Looking for retest on 0.618 fib level or break & retest on daily structure
-Potential BUY/SELL if there's confirmation on lower timeframe
-Pivot point: 3015, 2950
Disclaimer:
This analysis is from a personal point of view, always conduct on your own research before making any trading decisions as the analysis do not guarantee complete accuracy.

XAU/USD 07 April 2025 Intraday AnalysisH4 Analysis:
-> Swing: Bullish.
-> Internal: Bullish.
Analysis and bias remains the same as analysis dated 04 April 2025.
Since last analysis price has printed a bearish CHoCH which is the first indication, but not confirmation of bearish pullback phase initiation.
Price is now trading within an established internal range.
Intraday Expectation:
Price to trade down to either discount of internal 50% EQ, or H4 demand zone before targeting weak internal high priced at 3,187,835
Note:
With the Federal Reserve's dovish stance and persisting geopolitical uncertainties, heightened volatility in Gold is expected to continue. Traders should proceed with caution and adjust risk management strategies in this high-volatility environment.
Price could also be driven by President Trump's policies, geopolitical moves and economic decisions which are sparking uncertainty.
H4 Chart:
M15 Analysis:
-> Swing: Bullish.
-> Internal: Bearish.
Price has printed as per last Friday's analysis by targeting weak internal low and printing a bearish iBOS.
Price has subsequently printed a bullish iBOS indicating bullish phase initiation.
Price is now trading within an established internal range.
Intraday Expectation:
Price to continue bullish, react at either premium of internal 50% EQ, or M15/H4 nested supply zone before targeting weak internal low priced at 2,970.215
Note:
With the Federal Reserve maintaining a dovish stance and ongoing geopolitical tensions, volatility in Gold prices is expected to remain elevated. Traders should exercise caution, adjust risk management strategies, and stay prepared for potential price whipsaws in this high-volatility environment.
Trump's tariff announcement will most likely cause considerably increased volatility and whipsaws.
M15 Chart:

Gold short 2.0Here we have the chart of my last 2 gold trades.
First trade was took at the top of the first down trend with an entry of 3053, here I was anticipating a move to the 2950 area, at least. It was a profitable trade, I closed half of the position for a 400 pip gain, with my SL then moved to 200 pips in profit - which was then hit on the break of the trend.
Following that price action we hit a massive 3 bar surge on the daily, massive move, massive momentum and unfortunately I was not in it! However this morning we seen more crazy move before the London open and I entered another short at 3145 when the STF was showing weakness, this is nicely in profit approaching 400 pips as I write this, SL at entry.
On the close of this latest hourly we see we have broke below the major trend, and next I will be looking for a re test of the trend line/area of consolidation where I will add to my position with the overall retracement target remaining a massive 2950 - will i hold it until then? Doubtful!

GOLD BREAKS SHARPLY — BUT THE MOVE WAS WRITTEN IN THE STRUCTUREFollowing a substantial decline in gold prices, which dropped more than 1000 pips, there is a possibility that the price may experience a minor correction before resuming its downward trajectory. It is imperative to acknowledge that trading gold in the current market conditions carries significant risks, and there is a substantial likelihood of incurring substantial losses.
