XAU/USD) Bullish trand analysis Read The ChaptianSMC Trading point update
technical analysis of Gold (XAUUSD) on a 2-hour timeframe, with a bullish outlook. Here's a breakdown
1. Trend & Structure:
Uptrend Channel: Price is moving within a clear upward channel, respecting the trendline.
Higher Highs and Higher Lows: Indicates strong bullish momentum.
2. Key Zones:
Key Support Level (Yellow Box): Around $3,158.49 – this is the "safe entry point" if price pulls back.
First Entry Point: Around $3,222.76 – likely a breakout entry above a local resistance.
Target Point: $3,378.01 – a projected bullish target based on continuation.
3. Indicators:
RSI (14): Currently above 70 (overbought zone), but still climbing. There's bullish strength, but a pullback may occur soon.
200 EMA: Positioned below current price, confirming the bullish bias.
Mr SMC Trading point
4. Expected Scenarios (2 Paths):
Bullish Continuation: Price keeps rising, respecting the uptrend and hitting the target.
Pullback and Bounce: Price may retrace to the support zone or trendline, then bounce back up to target.
Summary of Idea:
This is a buy setup:
Buy at breakout above $3,222.76 (First Entry)
Safer buy at $3,158.49 (Support Re-test)
Target: $3,378.01
Watch RSI for pullback clues.
Pales support boost 🚀 analysis follow)
USCGC trade ideas

XAU/USD... SELL TREND 15M CHART PATTREN.im now selling GOLD at 3220, with a target of 3190.
Here’s the updated trade setup:
Trade Type: Sell
Entry: 3220
Target: 3190
Total Target Range: 30 points
If you're scalping or swing trading, here are a few suggestions:
Stop Loss (SL): Consider placing it around 3230–3235 to limit potential losses.
Risk-Reward Ratio: With a 10–15 point SL and a 30-point TP, your risk-reward is about 1:2 to 1:3 — solid setup.
Trailing Stop: Once the trade moves 10–15 points in your favor, trail your stop to breakeven.
Want help calculating exact profit or setting this up for a specific trading platform (like MetaTrader or TradingView)?

Gold Soars: New Record & Lucrative SignalsAs expected, trade tensions continue to stimulate the demand for gold. The price of gold per ounce has just set a new record of $3,340. The US dollar is still under pressure from trade frictions, which have begun to have a real impact on American companies and have intensified domestic concerns about an economic recession in the United States. Trump's frequent changes in tariff announcements have eroded investors' confidence in US policies and reduced their confidence in the US economy.
On the daily chart, starting from the low point of $2,536.68, the price of gold has formed a sustained upward trend. Currently, the price is around $3,300, significantly higher than all major moving averages, indicating that the long-term bullish momentum remains strong. The golden cross pattern of the MACD indicator on the daily chart continues to develop, suggesting that the long-term trend momentum is still upward. The daily RSI reading is 73.45, which has entered the overbought area. It is worth noting that the price recently broke through the resistance level of $3,230.00 and then continued to rise, which further verifies the situation where the bulls are in control.
In the short-term 4-hour cycle, as the price is strongly rising unidirectionally, pay attention to the support of the 5-day moving average. We can continue to be bullish as long as the price stays above $3,310. Judging from the 1-hour chart, the price of gold has maintained a strong upward momentum and is currently around $3,340.
XAUUSD
buy@3310-3330
tp:3340-3360
Investment itself doesn't carry risks; it's only when investment is out of control that risks arise. When trading, always remember not to act on impulse. I will share trading signals every day. All the signals have been accurate without any mistakes for a whole month. No matter what gains or losses you've had in the past, with my help, you have the hope of achieving a breakthrough in your investment.

Gold signal, 200% profit in one weekGold hit the highest point of 3245 at the opening today and then began to fall back. This is what we have been saying that gold is going to start to fluctuate and adjust. Now it depends on whether gold starts to adjust by exchanging space for time or time for space. However, no matter which method is used, gold must patiently wait for the opportunity to fall back. The hourly moving average of gold is still in a bullish arrangement with a golden cross upward. Now the price is gradually approaching the moving average. If gold uses time to exchange space for adjustment, then gold will continue to resist falling at a high level. Then gold may start to exert strong strength in the European and American markets. At that time, just continue to follow the trend and buy more.
Judging from the current gold trend, today we still focus on the short-term suppression of 3245-3250, and the short-term support of 3200-3206, with a focus on the support of 3188-90. Don't chase the current high position. The daily level reversal and negative closing may occur at any time.
Gold operation strategy:
If gold falls back to 3200-06 and does not break, you can buy more. If it falls back to 3188-90, you can add more positions, stop loss at 3178, target 3248-3250, and continue to hold if it breaks;

3382 , next ATH number today, GOLD⭐️GOLDEN INFORMATION:
Gold price (XAU/USD) enters a phase of consolidation on Thursday, trading within a narrow range near its all-time high reached during the Asian session, as investors digest conflicting market signals. Stronger-than-expected US Retail Sales figures and hawkish remarks from Federal Reserve (Fed) Chair Jerome Powell have lent support to the US Dollar (USD), curbing some of gold’s upside momentum. Meanwhile, the upbeat sentiment across equity markets and mildly overbought technical conditions are prompting traders to remain cautious, limiting fresh buying interest in the precious metal for now.
⭐️Personal comments NOVA:
Gold price continues to increase today, the fomo still has no end, pay attention to the new ATH price zone 3382
⭐️SET UP GOLD PRICE:
🔥SELL GOLD zone : 3381- 3383 SL 3388
TP1: $3370
TP2: $3355
TP3: $3333
🔥BUY GOLD zone: $3302 - $3300 SL $3295
TP1: $3310
TP2: $3320
TP3: $3330
⭐️Technical analysis:
Based on technical indicators EMA 34, EMA89 and support resistance areas to set up a reasonable BUY order.
⭐️NOTE:
Note: Nova wishes traders to manage their capital well
- take the number of lots that match your capital
- Takeprofit equal to 4-6% of capital account
- Stoplose equal to 2-3% of capital account

Gold initiates its trajectory toward the $4,000 markGold (XAU/USD) has confirmed a major bullish breakout from a long-term Cup and Handle formation, pointing to a macro target of $4,044.90. While price approaches immediate resistance at $3,404.72, the bullish structure remains intact above the breakout support zone. A retracement towards ISL or SL zones could offer potential re-entry opportunities in line with the prevailing uptrend.

The Secret Behind Stop-Loss Sweeps & How to Escape the Psycholog“You’re not losing trades because you’re unlucky…
You’re losing because someone out there is smarter — and they're hunting your stop.”
It’s time you see the real game behind every wick, fakeout, and reversal.
This isn’t guesswork. It’s called Liquidity Hunting — and it’s how institutions profit off retail emotions.
💥 What Is Liquidity Really?
Everyone talks about liquidity, but let’s break it down clearly:
Liquidity = Clusters of pending orders.
Mostly stop-losses. Mostly from retail. Mostly sitting in the same obvious places.
Where exactly?
Right below clean support
Right above clean resistance
Just beyond that third trendline touch
You’ve seen it.
Price tags your SL by a few pips… then rockets in the direction you predicted.
That’s not a mistake. It’s a setup.
🎯 What Do Smart Money Players Want?
They don’t enter like you do.
They can’t.
They move millions, even billions — they need:
A crowd of retail orders to fill theirs
A trap that looks like a breakout
An emotional wave of buyers/sellers to feed on
So what do they do?
They build the illusion.
They wait for you to bite.
And then they take your exit…
To enter their position.
⚙️ The 4-Phase Blueprint of a Liquidity Hunt
1. Build the Trap
Let price form something retail can trust:
Triple tops
Equal lows
Picture-perfect support zones
Trendlines with three or more touches
Retail piles in. SLs stack up.
Now the trap is ready.
2. Sweep the Zone
One violent move.
Break support
Break resistance
Wick everyone out
Trigger fake breakouts
Retail thinks it’s “the real move.”
But it’s just smart money collecting liquidity.
3. Shift the Structure (BOS / MSS)
Immediately after the sweep:
Price reverses
Recent structure breaks
Momentum shifts
This is your real signal.
The Break of Structure confirms:
The trap was sprung — and now it’s your turn to act.
4. Enter Like a Sniper (FVG / OB)
Now price pulls back to:
A Fair Value Gap (imbalance left from the sweep)
A Bullish or Bearish Order Block (last candle before the move)
This is your entry.
It’s clean.
It’s logical.
And it’s completely opposite from the crowd.
🧠 A Real-World Example
Gold is trading near $1,980.
There’s clean resistance at $2,000.
Everyone says:
“If 2,000 breaks, I’m buying with a target at 2,010 and SL at 1,995.”
Price spikes to $2,002.
They enter.
Then… crash to $1,987.
All SLs gone.
Then… it pumps to $2,020.
Sound familiar?
That’s the sweep.
That’s the trap.
That’s the game.
❌ Why Retail Keeps Losing
They chase breakouts
They place SLs where everyone else does
They act on emotion
They never wait for confirmation
✅ How to Flip the Script
Here’s how to trade like smart money:
Spot the Liquidity Zones
Equal highs/lows. Obvious trendlines. Clean support/resistance.
That’s where stop-losses live.
Wait for the Sweep
Don’t guess. Wait for the trap to be triggered.
Watch for that fake move.
Watch for Structure Shift
When the market flips direction and breaks a key level — that’s your cue.
Enter on the Pullback (OB or FVG)
Let price come to you.
Your SL is small.
Your RR is massive.
Your mindset is cold.
🔥 Final Mindset Shift
“If I were a bank… where would I trap people?”
That’s how institutions think.
They don’t trade signals — they create them.
They don’t follow trends — they reverse them.
They don’t chase — they hunt.
Now that you know the game...
Trade the trap. Not the bait.

XAUUSD Reversal imminent. Potential short-term top reached.Gold (XAUUSD) hit the 1-month Higher Highs trend-line and has started to form a short-term Top. The last two short-term High sequences peaked on the 2nd High and pulled-back to at least the 4H MA50 (blue trend-line).
The peak formation on the 4H RSI of those two sequences was demonstrated with Lower Highs. Similarly the most optimal short-term buy was when the 4H RSI got oversold below 30.00. At the same time, the price hit the 4H MA200 (orange trend-line).
But for now, the best action is to sell and take profit when the price makes contact with the 4H MA50.
-------------------------------------------------------------------------------
** Please LIKE 👍, FOLLOW ✅, SHARE 🙌 and COMMENT ✍ if you enjoy this idea! Also share your ideas and charts in the comments section below! This is best way to keep it relevant, support us, keep the content here free and allow the idea to reach as many people as possible. **
-------------------------------------------------------------------------------
Disclosure: I am part of Trade Nation's Influencer program and receive a monthly fee for using their TradingView charts in my analysis.
💸💸💸💸💸💸
👇 👇 👇 👇 👇 👇

Gold’s Quiet Ascent to a New Era?Gold has recently regained strong attention as the US dollar weakens, largely due to unstable trade policy in the United States. While the dollar remains the world’s primary reserve currency, there are growing signs that gold is becoming a more reliable alternative in an increasingly uncertain global landscape.
A key catalyst is China’s decision to allow insurance companies to allocate more of their assets into gold. This move alone could generate hundreds of tons in additional demand each year — a significant force in a market where global supply remains limited.
Meanwhile, major banks like Citi, UBS, Goldman Sachs, and Bank of America have all revised their gold forecasts upward for 2025–2026. Some targets now reach as high as $3,500/ounce, reflecting growing conviction that gold is entering a new bull cycle — not just short term, but across the medium and long term.
To me, this isn’t just a reaction to recent headlines — it signals a deeper shift in how institutions are revaluing gold’s role. The $100 surge last Wednesday marked a peak in market enthusiasm, and it’s likely just the beginning.
We might see minor pullbacks ahead, but the broader trend is intact. If gold truly breaks into a new price range in the coming quarters, this could be a crucial time to prepare, observe, and identify well-timed Buy entries.

GOLD: Long Trading Opportunity
GOLD
- Classic bullish formation
- Our team expects growth
SUGGESTED TRADE:
Swing Trade
Buy GOLD
Entry Level - 3225.9
Sl - 3218.11
Tp - 3240.8
Our Risk - 1%
Start protection of your profits from lower levels
Disclosure: I am part of Trade Nation's Influencer program and receive a monthly fee for using their TradingView charts in my analysis.
❤️ Please, support our work with like & comment! ❤️

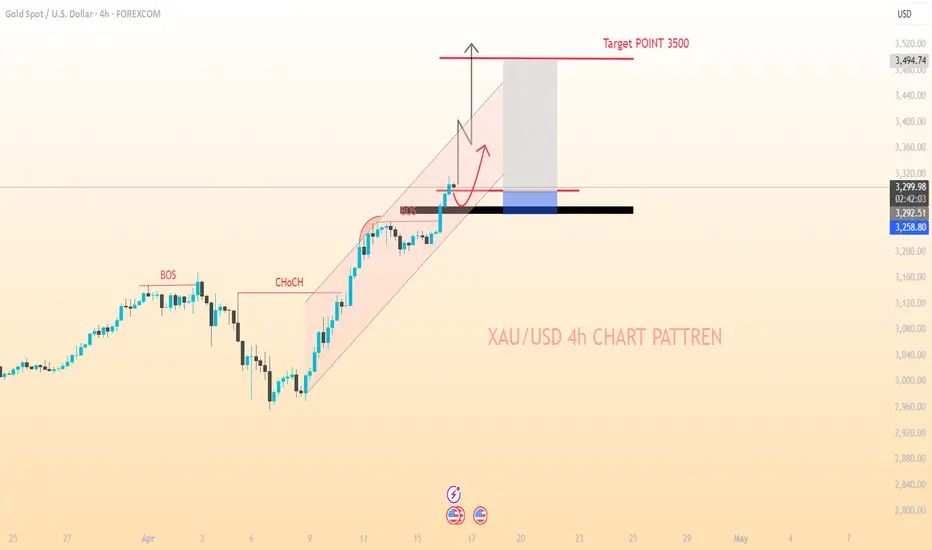
XAU/USD...4h ChartPattrenMY gold trading signal looks clear and concise. Here's a breakdown of the key elements:
*Signal Details*
1. *Entry Price*: 3296
2. *Target Price*: 3500
3. *Stop Loss*: 3250
4. *Sentiment*: Bullish, indicating strong momentum in gold prices.
*Format and Updates*
1. *Text Format*: The current format is straightforward and easy to understand. It's great for quick communication and can be easily shared via text or messaging platforms.
2. *Graphic Version*: Creating a graphic version could enhance visual appeal and make the signal stand out. You could include:
- A chart showing the entry point, target, and stop loss.
- Icons or colors to highlight bullish sentiment.
- Additional information like current price, potential profit/loss, and risk level.
*Considerations for Future Signals*
1. *Consistency*: Keeping a consistent format for your signals can help recipients quickly understand and act on them.
2. *Additional Information*: Consider including more details such as:
- Time frame for the signal (short-term, long-term).
- Rationale behind the signal (technical indicators, news, etc.).
- Risk management tips specific to this trade.
3. *Update Frequency*: Decide how often you'll update the signals. Regular updates can keep recipients informed about market changes.
*Next Steps*
- *Feedback*: Gather feedback from your audience on the preferred format and content of the signals.
- *Automation*: If you're planning to send out signals frequently, consider automating the process using trading software or platforms that can generate and send signals based on predefined criteria.
- *Education*: Provide educational resources or explanations about the signals and trading strategies to help recipients understand and make informed decisions.
Would you like to explore creating a graphic template for your signals or discuss ways to automate signal generation and distribution?
XAUUSD buy zone in 1h break of structureLast 3 days of past week XAUUSD had a strong uptrend with bullish momentum. From 1h perspective we have seen price had a bounce, and there is no significant break of structure on the lower timeframe, which means, as with the new market open, any break of structure is an opportunity to go long. Expecting to test the previous swing low is a zone where we can look for for potential entry to ride the trend.
Will wait for price action confirmation on market opening.

Lingrid | GOLD bullish MOMENTUM Continues. Pullback OpportunityThe price has perfectly fulfilled my previous forecast . OANDA:XAUUSD market surged straight up and reached the resistance level at 3200 without any pullback. Additionally, the price broke and closed above last week's high, confirming bullish continuation. As the market tests this key level, we may see increased volatility in this area considering that we have high-impact news in the NY session. The price seems to be decelerating at the channel border, which suggests there might be a corrective move in the market. If the price makes a pullback toward the support level, there is a strong opportunity to go long, with the potential for the price to continue moving upwards. My goal is resistance zone around 3275
Traders, if you liked this idea or if you have your own opinion about it, write in the comments. I will be glad 👩💻

Gold Falls Like Waterfalls (Bearish Gold)Hello Traders Here is my First Ideas About Gold Kindly Share your opinions About it.
XAUUSD (GOLD) Will Drop From Current area After making a new High Gold is ready to falls I have Simply Shared my opinions about Gold That price will drop to 3190 -91 which is also a strong support of the Week.
Keep Boost my ideas & Follow for timely updates.

Gold XAUUSD Possible Setup 15/04/2025🧠 Technical Analysis:
Trend Structure:
The price was following a short-term ascending channel (bullish structure).
Recently, price broke below the lower trendline, indicating a potential bearish shift.
Support Zones:
First support zone: 3210–3214
This is a minor support and could serve as the first potential bounce area.
Second support zone: 3189–3194
This is a stronger historical demand zone. Stronger bounce expected from here if the price continues falling.
Resistance Zone:
Around 3241–3245, which is the recent high and also aligns with prior resistance.
Price Action:
Bearish engulfing candles and a break below the trendline indicate bearish momentum in the short term.
Current price: ~3219. If selling pressure continues, price might retest 3210 or even 3190.
📉 Trading Signal:
✅ Buy Signal 1 – Aggressive Entry
Entry Zone: 3210–3214
SL: Below 3203
TP1: 3235
TP2: 3245
RR: ~1:2+
✅ Buy Signal 2 – Conservative Entry
Entry Zone: 3189–3194
SL: Below 3182
TP1: 3210
TP2: 3235
RR: ~1:3+
📌 Note: Wait for bullish confirmation (e.g., bullish engulfing or pin bar) near either support zone before entering.
🔄 Summary:
Price broke ascending structure = short-term bearish
Look to buy from 3210–3214 (aggressive) or 3189–3194 (conservative) on bullish confirmation.
Hit follow, like and comment.

Gold fluctuates at high levels and is under pressure to adjust!Gold's 1-hour moving average has begun to turn gradually, and the bullish force has begun to weaken. It may continue to adjust in the short term. The 1-hour short-term double top structure, the rebound did not continue to set a new high, and the rebound began to fall under the pressure of 3232. The trend of the small-level cycle maintains a slightly stronger trend along the short-term moving average. Pay attention to the short-term adjustment. It is still mainly short-selling on the rebound, and it is still maintained near 3227-30 to participate in short orders. It is expected that gold will continue to adjust in the future, and 3200 is likely to be broken. On the whole, it is recommended to mainly short-sell on the rebound, and to buy on the callback as a supplement. The short-term focus on the upper side is 3230-3232. The short-term focus on the lower side is 3200-3210. Gold operation strategy reference: Strategy 1: Short (buy short) two-tenths of the position in batches near 3227-3230 of gold rebound, stop loss 6 points, target near 3215-3210, break to see 3200 line;

How to grasp the high-level fluctuations of gold?The gold market is still maintaining a strong trend. From the current technical point of view, the daily line closed with a negative line, and the small negative line after three consecutive positive lines is still bullish. If the daily line does not break the new high of 3245, we should pay attention to the possibility of adjustment, and after the daily line closes with a negative line, the top is determined, and there is a possibility of a sharp drop in the future. Therefore, although it is a bullish trend for the time being, we should pay attention to the possibility of adjustment in gold and the changes in the daily line cycle. Reference for gold operation strategy: When gold pulls back to around 3213-3215, go long (buy up) in batches with 20% of the position, stop loss 6 points, target around 3230-3240, and look at the 3250 line if it breaks;

Gold Third Scenario , Depend On Breakout , What`s Your Opinion ?Here is the update for the last idea i post for Gold , if we take a look now we will see that he price moving in sideway and still not touch my support , so do yo uthink the price will go up without retest it ? or should we keep the first analysis ?

Gold (XAUUSD) Bullish Breakout Setup – Targeting 3,394.56 After EMA 30 (Red Line): Currently at 3,109.56
EMA 200 (Blue Line): Currently at 3,064.85
Price is above both EMAs, indicating bullish momentum in the short and long term.
📈 Trade Setup:
Entry Point: Around 3,162.15
Stop Loss Zone: Below the purple support box around 3,109–3,141 (right above the 30 EMA)
Target (Take Profit): 3,394.56 — marked as "EA TARGET POINT"
📊 Strategy Outlook:
Bullish Setup: The price recently broke out of a resistance zone (purple area) and retested it, confirming the breakout.
The risk-to-reward ratio appears favorable, as the target is significantly higher than the stop loss.
The upward price projection suggests confidence in a strong bullish continuation.
⚠️ Things to Watch:
Volume confirmation and price action near the entry level.
If price closes below the 30 EMA, it may invalidate the setup.
Always consider broader macroeconomic or fundamental factors when trading gold (e.g., USD strength, interest rates, geopolitical tension).

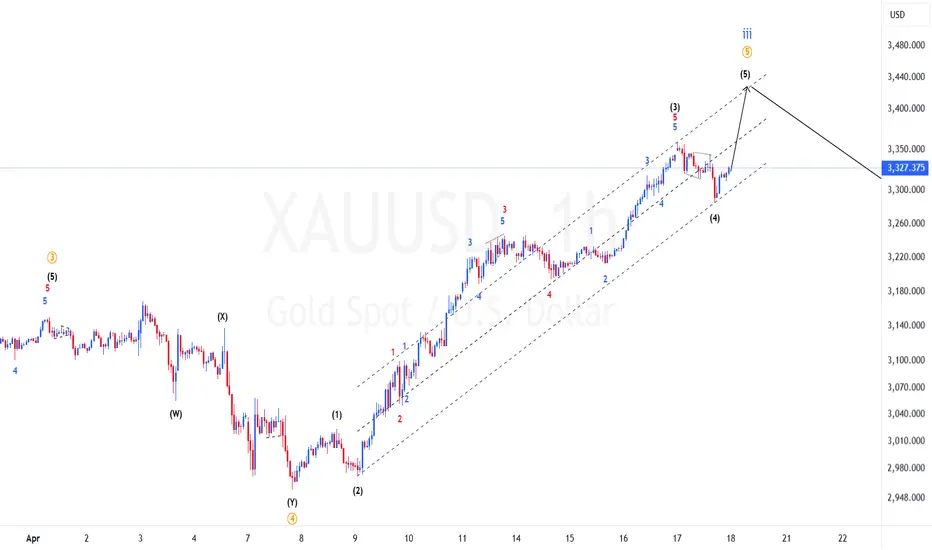
XAUUSD update: Is 4th wave complete?On our previous analysis we were expecting price to start decline to form 4th wave of higher degree but price instead of creating na impulsive down we had a clean zigzag signaling we are not yet done with the 5th wave. Now we have a recount of this 5th wave and we can see we still bullish. If this current count is correct we should expect price to continue up and find resistance at the upper trendline. Lets monitor it for a possibility of taking advantage of the continuation higher.
Gold Ideas for 14th of April📊 Market Structure Overview
Trend Analysis: Price has reached premium levels, suggesting a potential for short-term pullbacks within the broader bullish trend.
Key Levels: Monitoring for breaks below 3025 to signal a shift in macro bias.
🔑 Key Technical Zones & Confluences
Premium Sell Zone: 3248–3268, characterized by unmitigated order blocks and potential liquidity traps.
Internal Demand Zone: Around 3180, aligning with trendline support and Fibonacci retracement levels.
Strong FVG & Order Block: 3137–3145, indicating a significant area of interest for potential reversals.
📝 Plan of Action
🔻 Sell Scenario 1
Entry: 3242 – 3248
Stop Loss: 3255
Take Profits: TP1: 3215 | TP2: 3188 | TP3: 3160
Rationale: Anticipating rejection from fresh M15 order block with liquidity sweep above 3242. RSI divergence noted as additional confluence; confirmation required on M5.
🔻 Sell Scenario 2
Entry: 3260 – 3268
Stop Loss: 3275
Take Profits: TP1: 3235 | TP2: 3200 | TP3: 3165
Rationale: Targeting final premium order block with unmitigated H1 zone and imbalance. Ideal for NY session traps; look for bearish engulfing patterns.
🟢 Buy Scenario 1
Entry: 3180 – 3172
Stop Loss: 3165
Take Profits: TP1: 3205 | TP2: 3230 | TP3: 3250
Rationale: Confluence of trendline and M30 order block with internal structure support. Requires bullish price action and CHoCH on M5 for confirmation.
🟢 Buy Scenario 2
Entry: 3137 – 3142
Stop Loss: 3129
Take Profits: TP1: 3180 | TP2: 3205 | TP3: 3240
Rationale: Major imbalance and H1 order block with RSI confluence. Look for bullish engulfing or aggressive CHoCH on lower time frames.
📌 Key Zones Recap
Premium Sell Zone: 3248–3268
Internal Demand Zone: 3180
Strong FVG & OB: 3137–3145
Critical Support: 3025 (break indicates macro bias shift)
📌 Important Notice!!!
The above analysis is for educational purposes only and does not constitute financial advice. Always compare with your plan and wait for confirmation before taking action.
📣 If this strategy sparked clarity, hit that like button and follow our community for more in-depth ideas. 💛

Gold (XAU/USD) Bullish Continuation Setup – Key Support Levels 📊 Chart Context & Setup
Chart Type: Candlestick
Indicators Used:
50 EMA (red): Currently at 3,199.009
200 EMA (blue): Currently at 3,123.168
Support Zone: Around 3,157.786 – 3,123.168
Current Price: Approximately 3,211.90
Focus Point (Target Zone): 3,283.810
🧠 Technical Analysis
🔹 Trend Analysis
Overall Trend: Bullish
Price is trading above both the 50 EMA and 200 EMA.
The EMAs are sloping upward, indicating strong momentum.
Golden Cross previously occurred (50 EMA crossing above 200 EMA).
🔹 Key Support & Resistance
Immediate Resistance Zone: Around 3,240
This area is acting as a potential rejection zone, with minor consolidation.
Support Zone (Highlighted): 3,157 – 3,123
This zone was previously a breakout level and now serves as a retest support.
It coincides with the 200 EMA, adding to its strength.
🔁 Scenarios Presented
Scenario A – Bullish Rejection from Immediate Support (3,199)
Price could hold above or near the 50 EMA.
Break and retest of minor resistance could lead to a push toward 3,283.81 (target).
This is a higher-risk entry as the support is not deeply tested yet.
Scenario B – Deeper Pullback to Major Support (3,157 – 3,123)
A drop below current price into the main demand zone.
Bullish engulfing or strong reaction in this zone would offer a high-probability long setup.
Ideal entry point for swing traders, especially if confirmed by volume or bullish candlestick reversal.
🎯 Trade Strategy Suggestion
✅ Long Setup
Entry Option 1: On bullish rejection above 3,199 with confirmation.
Entry Option 2 (Preferred): At strong support zone 3,157 – 3,123 with bullish reversal signal.
Target: 3,283.81
Stop Loss:
For Entry 1: Below 3,157
For Entry 2: Below 3,100 or 200 EMA, depending on aggressiveness
📌 Conclusion
This chart illustrates a classic bullish continuation setup with two potential entry scenarios:
A minor pullback and bounce from the 50 EMA.
A deeper retracement into a strong support zone aligned with the 200 EMA.
The uptrend remains intact as long as the price holds above the 200 EMA and the major demand zone. A break below 3,100 would invalidate the bullish outlook short-term

Best Technical Indicator to Identify Order Block & Imbalance
Your ability to correctly identify Order Blocks on a price chart is essential for profitable trading Smart Money Concept.
In this article, I will show you a great technical indicator that will help you to spot Order Blocks on any financial market.
First, in brief, let me give you my definition of Order Block.
The problem is that in SMC trading there is no one single definition of that and many traders interpret it differently.
To me, an Order Block is a specific zone on a chart from where a strong price movement initiates and where a significant imbalance between supply and demand occurs .
This imbalance should strictly originate from a liquidity zone.
That definition implies that in order to identify an Order Block zone, one should learn to properly identify the imbalance and liquidity zones.
And again, there is no precise definition of an imbalance on a price chart. To me, a bullish imbalance is a formation of a bullish engulfing candle - the one that engulfs a range of previous bearish candle with its body.
Above is the example of a valid Order Block on GBPUSD.
A bearish imbalance is a formation of a bearish engulfing candle - the one that engulfs a range of a previous bullish candle with its body.
Above, you can see the example of an Order Block on USDCAD, based on a bearish imbalance.
There is one technical indicator that will help you to recognize such Order Blocks. It is called " All Candlestick Patterns" on TradingView.
Open settings of the indicator and make it show ONLY Engulfing Candles and choose "No Detection" in "Detect Trends Based on".
After that, hide the indicator and first, Identify the liquidity zones on a chart and wait for a test of one of these zones.
Here is a test of a liquidity zone on NZDUSD on an hourly time frame.
After that, turn on the indicator, and wait for its signal.
You can see that after some time, the price formed a bullish imbalance with a bullish engulfing candle. The indicator highlight that candle.
The Order Block zone will be based on the lowest low of 2 candles and the high of a bearish candle preceding the imbalance.
One more example. We see a test of a significant liquidity zone on EURAUD on a 4H time frame.
We turn on the indicator and look for a signal.
A bearish imbalance is formed and the indicator immediately notifies us.
An Order Block Zone in that case will be the area based on the highest high of 2 candles and the low of a bullish candle preceding the imbalance .
Of course, there will be the rare cases when the indicator will miss the imbalances. But while you are learning to recognize Order Blocks, this indicator will definitely help you a lot!
Thank you for reading!
❤️Please, support my work with like, thank you!❤️
I am part of Trade Nation's Influencer program and receive a monthly fee for using their TradingView charts in my analysis.
