Gold is in the Bullish DirectionHello Traders
In This Chart GOLD HOURLY Forex Forecast By FOREX PLANET
today Gold analysis 👆
🟢This Chart includes_ (GOLD market update)
🟢What is The Next Opportunity on GOLD Market
🟢how to Enter to the Valid Entry With Assurance Profit
This CHART is For Trader's that Want to Improve Their Technical Analysis Skills and Their Trading By Understanding How To Analyze The Market Using Multiple Timeframes and Understanding The Bigger Picture on the Charts
USCGC trade ideas
KEEP TRADING SIMPLE - GOLDGood Morning,
Gold is not looking so hot right now - We are seeing some rejection in the market and it looks like lower lows are on the horizon. I do not personally expect the current support to hold. If it does not we are looking at a short term correction and trend change.
If it bounces off the current resistance that will be the sign of confirmation.
Thanks

XAU/USD 04 April 2025 Intraday AnalysisH4 Analysis:
-> Swing: Bullish.
-> Internal: Bullish.
Since last analysis price has printed a bearish CHoCH which is the first indication, but not confirmation of bearish pullback phase initiation.
Price is now trading within an established internal range.
Intraday Expectation:
Price to trade down to either discount of internal 50% EQ, or H4 demand zone before targeting weak internal high priced at 3,187,835
Note:
With the Federal Reserve's dovish stance and persisting geopolitical uncertainties, heightened volatility in Gold is expected to continue. Traders should proceed with caution and adjust risk management strategies in this high-volatility environment.
Price could also be driven by President Trump's policies, geopolitical moves and economic decisions which are sparking uncertainty.
H4 Chart:
M15 Analysis:
-> Swing: Bullish.
-> Internal: Bearish.
Price has printed as per yesterday's alternative scenario whereby price has printed a bearish iBOS due to H4 TF being in, although not as yet confirmed, in bearish pullback phase.
Intraday Expectation:
Price has already traded up to premium of internal 50% EQ, therefore, price to target weak internal low priced at
Note:
With the Federal Reserve maintaining a dovish stance and ongoing geopolitical tensions, volatility in Gold prices is expected to remain elevated. Traders should exercise caution, adjust risk management strategies, and stay prepared for potential price whipsaws in this high-volatility environment.
Trump's tariff announcement will most likely cause considerably increased volatility and whipsaws.
M15 Chart:

XAUUSD 15M Analysis: A Potential Reversal for Gold Prior to NFPGold (XAUUSD) is approaching a key demand zone, which could offer a potential buying opportunity. Here’s a breakdown of my analysis and trade expectations:
1️⃣ Market Structure & Trend Analysis
• Price is currently in a short-term downtrend, creating lower highs and lower lows.
• However, a Monitor Buy Zone has been identified, where price previously found strong support and liquidity.
• A reaction from this level could trigger a bullish reversal.
2️⃣ Expected Price Movements
• Bullish Scenario: If price reaches the Monitor Buy Zone (3,067 - 3,047) and shows bullish confirmation (e.g., wicks, engulfing candles), we could see a rebound toward 3,095 - 3,100 as the first target.
• Bearish Scenario: If price breaks below the 3,047 support level with strong bearish momentum, it could invalidate the buy setup and push lower toward new demand levels.
3️⃣ Key Levels to Watch
• Resistance Levels:
• 3,095 - 3,100: Initial target zone for a bounce.
• 3,120: Potential extended target if momentum continues.
• Support Levels:
• 3,067: First reaction level in the Monitor Buy Zone.
• 3,047: Last level of defense before a deeper drop.
4️⃣ Trade Plan & Risk Management
• Entry: Looking for bullish confirmations at the Monitor Buy Zone before entering a long position.
• Stop Loss: Below 3,047, ensuring minimal risk if the trade setup fails.
• Take Profit Levels:
• First TP at 3,095 - 3,100 (safe target).
• Extended TP at 3,120 (if bullish momentum continues).
5️⃣ Confluences for a Long Setup
• Liquidity Grab Possibility: Price could sweep below previous lows before reversing.
• Historical Support: Price has bounced from this region before, adding strength to the buy zone.
• Fibonacci Levels: Possible alignment with key retracement zones for added confirmation.
Final Thoughts:
I’ll be closely watching price action at the Monitor Buy Zone before entering a trade. If price respects this area and bullish momentum builds, we could see a strong rebound.
What’s your bias on XAUUSD? Drop your thoughts in the comments!

Gold fluctuates sharply at high levelsToday, the market focuses on the US non-farm payrolls data for March, including key indicators such as unemployment rate, non-farm payrolls and wage growth. The market generally expects:
The unemployment rate remains unchanged at 3.9%
The number of farm payrolls may be lower than the previous value of 275,000
The average hourly wage growth rate may slow down
From the perspective of expectations, the data is generally favorable for gold. However, it is necessary to be vigilant that the ADP employment data released this week performed strongly. If today's non-farm payrolls are also better than expected, it may put pressure on gold prices. Therefore, it is expected that gold will maintain a volatile pattern during the day, waiting for data guidance.
Technical analysis
Daily level:
Yesterday, the gold price fluctuated violently, first falling from the high of 3167 to the low of 3062, a drop of $1,000, and then rebounding strongly from the low of 3054 to 3135 during the US trading period, and finally closed at around 3100
The daily line formed a large negative line with an ultra-long lower shadow, showing a fierce battle between bulls and bears
$3100 became a key psychological barrier, which was both the low point of yesterday's retracement and the previous double bottom support
1-hour level: The moving average system showed signs of turning downward, and the downward trend line suppression level moved down to around 3108
Key price
Upper resistance: 3108 (trend line suppression) → 3135 (yesterday's US trading high)
Lower support: 3100 (psychological barrier) → 3085 → 3057/3054 (top and bottom conversion position)
Trading strategy
Short strategy:
Entry point: around 3108 (trend line suppression)
Stop loss: above 3118
Target: around 3060
Applicable conditions: no strong breakthrough in European session
Long strategy:
First look at 3100 support, and try long with a light position if it stabilizes
If it falls below 3100, pay attention to the support level of 3085/3057
For a better profit and loss ratio, you can consider arranging mid-term long orders
Risk warning
Non-agricultural data may cause violent fluctuations. It is recommended to reduce positions or wait and see before the data
If the European session breaks through the suppression of 3118, you need to give up the idea of short orders
Strictly control stop loss and guard against false breakthrough risks
Pay attention to the impact of the difference between the actual value of the data and the expectation on the market
Summary
Gold has entered the consolidation stage after experiencing a huge shock of 100 points. Non-agricultural data may become a key factor in breaking the current balance. Suggestions for investors:
3108 is the watershed for the Asian and European sessions, and high-altitude trading is the main focus
Adjust positions before the US session to cope with the non-agricultural market
Focus on the breakthrough of 3100 support and 3108 resistance
Flexibly adjust strategies based on actual performance after data is released

Gold Intraday Trading Plan 4/4/2025Gold was quite mad yesterday. After touched a new ATH of 3167, it quickly dropped more than 1k pips to 3155 and went back another 800pips to 3135. Finally it closed the day above 3110.
While in smaller timeframes it showed bearish signals, in 12hrly TF, it is above EMA and daily support of 3105. I will be cautious about trading today as it is NFP today.
In short, I will trade breakout today. If 3137 is broken, i will buy towards 3175. If 3105 is broken, I will sell towards 3137.

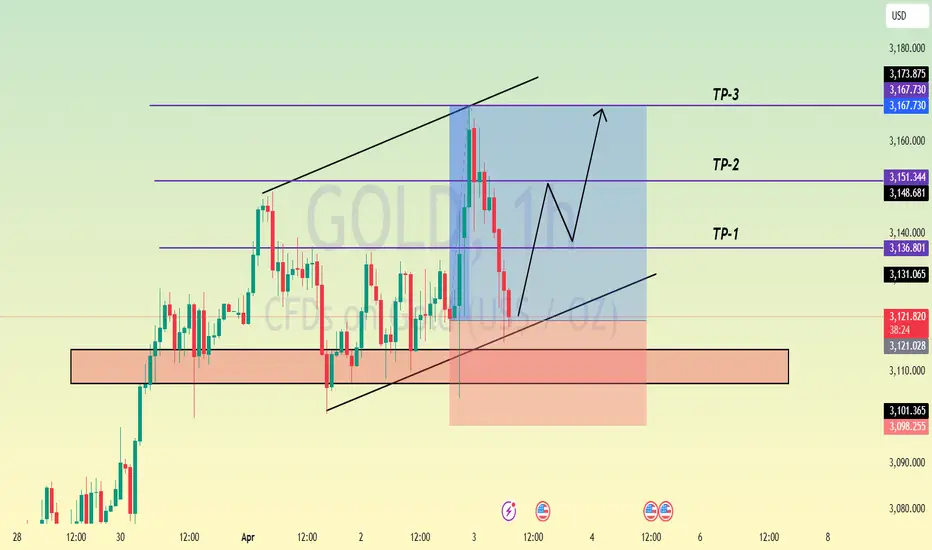
Gold-----Buy near 3140, target 3160-3180Gold market analysis:
The international situation is very unstable, the situation in the Middle East, the situation in Russia and Ukraine, plus Trump's trade war, it is difficult for gold to show a weekly decline. The tariffs were released again last night, causing gold to rise strongly. Today's thinking is undoubtedly to continue to be bullish. Today we will first look for structural support to go long. There was a decline in the Asian session, and the daily moving average began to rise. Today, it will be repaired first and then pulled up.
In terms of gold pattern, 3134 is the strong pattern support in the Asian session, and the small support is around 3140. Bulls will play at this position. We estimate that there will be a few pulls in the Asian session today. The range of getting on the train is around 3134-3140. The strong support has reached around 3110. If this position is not broken, it is basically difficult to change the buying trend during the day. In addition, tomorrow is the non-agricultural data, and we estimate that such buying will reach the non-agricultural data.
Support 3134-3140, strong support 3120 and 3110, strong pressure is invisible, small pressure today's high point, the strength and weakness watershed of the market is 3134.
Operation suggestion:
Gold-----Buy near 3140, target 3160-3180

XAUUSD UNEMPLOYEMENT CLAIM BREAKOUT ALERT!🚨 XAUUSD Update 🚨
🔥 Price Action: XAUUSD is locked between 3144 and 3151—breakout imminent?
📉 Bearish View: If it drops below this range, watch for targets at 3130 and 3120. Stay sharp!
📈 Bullish View: A break above 3151 could set up buying opportunities. Target 3165 and 3200.
💬 Join the Discussion: Drop your thoughts and strategies below! Let’s ride the golden wave together! 💰🚀

BIG MOVE COMING IN XAUUSD GOLD ! CHECK SWING LEVEL'S BIG MOVE COMING IN XAUUSD GOLD ! CHECK SWING LEVEL'S
Intraday trader's ,Swing trader's follow carefully. Trend is bullish ,no doubt.Short term correction may happen , if sustain below 3127.69 target is around 3097-3089 level.Buying target is 3180 in upcoming days. Best buying zone above 3144 ,for me i'm looking for 3080 if possible.

A must-read for those who accurately hit TP and get liquidated!3.31: Three orders were made, short at 3121, close at 3113 and long at 3103, close at 3116. BTC82000 long at 83000 close. If you are losing money or your account is liquidated, please check my homepage and contact me. I will never let you down if you trust me. I have many years of market experience.
The spot gold price broke through the $3120 per ounce mark, rising nearly $40 at one point, reaching a record high of $3128. This amazing rise was mainly driven by market concerns about the Trump administration's upcoming tariff policy, and investors flocked to gold, a traditional safe-haven asset, to seek shelter. The cumulative increase in March has exceeded 9%, and is expected to record the largest monthly increase in nearly a year.
On Monday, the international gold price continued to rise, with the spot gold price breaking through the $3120 per ounce mark, rising nearly $40 at one point, reaching a record high of $3128, an increase of about 1.3%. This amazing rise was mainly driven by market concerns about the Trump administration's upcoming tariff policy, and investors flocked to gold, a traditional safe-haven asset, to seek shelter. The cumulative increase in March has exceeded 10%, and is expected to record the largest monthly increase in nearly a year.
Technical indicators show that $3,000 has become a new support level. I predict that gold prices may hit $3,180 in the short term, and the target will be raised to $3,300 by the end of the year.
The market is paying attention to the US reciprocal tariff plan on April 2 and Friday's non-agricultural data. Goldman Sachs warned that tariff escalation may cause US core PCE inflation to rise to 3.5% and GDP growth to slow to 1%. Analysts are generally bullish on gold, and 85% of institutions predict that the rise will continue. Under the resonance of risk aversion and inflationary pressure, gold may remain strong in the short term, but it is necessary to be vigilant about the possible technical correction to the 3040-3090 range in mid-April.
Geopolitical tensions have further exacerbated market uneasiness. US President Trump's latest statement on Sunday said that if he believes that Moscow is hindering his efforts to end the war in Ukraine, he will impose a secondary tariff of 25% to 50% on all Russian oil. This tough stance has heightened market concerns about the deteriorating global trade environment, providing additional impetus for gold prices to rise.
From a macroeconomic perspective, rising inflation expectations have also supported gold's gains. San Francisco Fed President Mary Daly's latest statement shows that recent inflation data has shaken her confidence in two rate cuts this year. This statement reinforces the market's expectations that the Fed may maintain a high interest rate policy for a longer period of time, and the value of gold as a traditional anti-inflation asset has been highlighted. So far this year, gold prices have risen by more than 18%, showing strong safe-haven appeal.
Despite the record highs in gold prices, analysts warned that the market may face the risk of short-term adjustments. If the tariffs announced this week are not as severe as people fear, then gold prices may start to fall as profit-taking at high levels may be triggered. "Market participants are waiting with bated breath for the final details of the Trump administration's tariff policy, which will determine the sustainability of gold's current rally.
In the current environment, gold has demonstrated its unique value as the "ultimate safe-haven asset". As geopolitical risks, trade tensions and inflation uncertainties persist, gold prices may continue to fluctuate at high levels. However, investors also need to be wary of possible profit-taking pressure after policy clarification, as well as the potential impact of the Fed's monetary policy direction on the gold market. The subsequent development of this gold feast dominated by risk aversion will still depend on the game results of multiple factors.

Gold price hits a new all-time high!Market news:
In the early Asian trading on Thursday (April 3), spot gold continued to rise, once refreshing its historical high to $3,168/ounce, as US President Trump declared a national emergency on Wednesday to enhance the competitive advantage of the United States, protect US sovereignty, and strengthen US national and economic security. He will impose a 10% benchmark tariff on all goods imported into the United States and impose higher tariffs on some of the largest US trading partners. This move will lead to an intensification of the trade war launched after his return to the White House, and the market risk aversion sentiment has risen sharply. After the news of large-scale tariffs came out, the market risk aversion sentiment rose sharply in the early Asian trading on Thursday, US stock futures plummeted, and Dow futures plunged more than 1,100 points. London gold prices soared, and international gold prices soared after US President Trump announced reciprocal tariffs on global trading partners. Gold is traditionally a safe-haven asset in times of geopolitical and economic uncertainty. When people's concerns about the global economy intensify, investors regard gold as a safe haven. Such concerns have helped gold prices rise 19% so far this year after a strong rally in 2024, driven mainly by massive central bank purchases and strong demand in Asia. The dollar index fell after Trump's tariff plan was announced, making gold more expensive for buyers holding foreign currencies. Investors need to pay attention to the number of layoffs in challenger companies in the United States in March, the number of initial jobless claims in the United States for the week ending March 29, and the ISM non-manufacturing PMI data in the United States in March. In addition, investors need to pay attention to the market's further interpretation of Trump's tariff policy and the response measures of various countries, and pay attention to changes in national stock market performance and risk aversion.
Technical Review:
At the daily level, gold started the downward adjustment mode on Tuesday, breaking the previous continuous rise in one fell swoop. However, the current moving average system still maintains an upward divergent trend. The 4-hour trend of gold temporarily maintains a high range of oscillation repair. At present, the short-term moving average is basically in a state of adhesion and flattening, and tends to continue to maintain a high-level oscillation repair trend during the day. The 1-hour moving average of gold is still a golden cross with upward bullish arrangement. Although gold fell below the moving average support yesterday, the strength of gold bulls to bottom out and rebound is still relatively strong, and with the support of gold safe-haven, gold bulls are still better. As long as it does not break 3100, it will continue to be strongly bullish.
Today's analysis:
The news of gold early in the morning upgraded the risk aversion, and gold broke upward again. Then the previous resistance of gold has now become support again. The previous platform support of gold at 3135 has broken upward, so gold has now formed support at 3135. Gold fell back in the Asian session and continued to buy. Since after the shock, gold bulls have exerted their strength again under the stimulation of risk aversion, the trend continues to belong to bulls, and gold fell back in the Asian session and continued to buy.
The 1-hour moving average of gold turned upward again, and gold bulls regained control of the home court. Gold fell back in the Asian session and continued to buy on dips on the previous platform support of 3135. Now risk aversion stimulates gold to rise. Don't chase it directly at high levels for the time being, and wait patiently for the opportunity to fall back. As risk aversion is upgraded, gold buying will continue to be strong and gold is expected to rise to a higher level.
Operation ideas:
Short-term gold 3132-3135 buy, stop loss 3124, target 3160-3170;
Short-term gold 3174-3177 sell, stop loss 3185, target 3140-3130;
Key points:
First support level: 3140, second support level: 3133, third support level: 3120
First resistance level: 3166, second resistance level: 3174, third resistance level: 3187

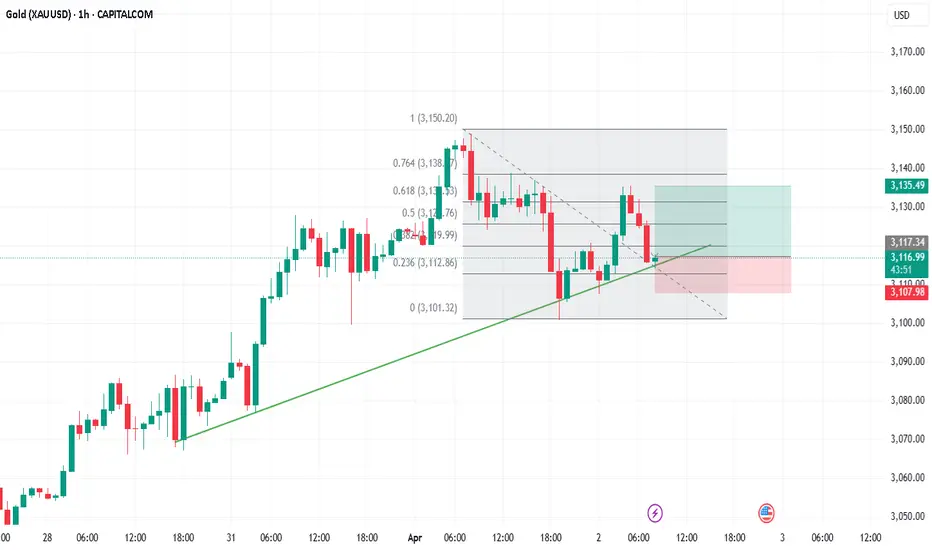
GOLD LONGWe are in an upward trendline. We are in a fair value gap. Also the pair is on a point of interest on the fibonnacci zone. we are at 0.236 level we want to go long till 3148 . We join the market at the current rate
3 Best Trading Opportunities to Maximize Profit Potential
Hey traders,
In the today's article, we will discuss 3 types of incredibly accurate setups that you can apply for trading financial markets.
1. Trend Line Breakout and Retest
The first setup is a classic trend line breakout.
Please, note that such a setup will be accurate if the trend line is based on at least 3 consequent bullish or bearish moves.
If the market bounces from a trend line, it is a vertical support.
If the market drops from a trend line, it is a vertical resistance.
The breakout of the trend line - vertical support is a candle close below that. After a breakout, it turns into a safe point to sell the market from.
The breakout of the trend line - vertical resistance is a candle close above that. After a breakout, it turns into a safe point to buy the market from.
Take a look at the example. On GBPJPY, the market was growing steadily, respecting a rising trend line that was a vertical support.
A candle close below that confirmed its bearish violation.
It turned into a vertical resistance .
Its retest was a perfect point to sell the market from.
2. Horizontal Structure Breakout and Retest
The second setup is a breakout of a horizontal key level.
The breakout of a horizontal support and a candle close below that is a strong bearish signal. After a breakout, a support turns into a resistance.
Its retest is a safe point to sell the market from.
The breakout of a horizontal resistance and a candle close above that is a strong bullish signal. After a breakout, a resistance turns into a support.
Its retest if a safe point to buy the market from.
Here is the example. WTI Crude Oil broke a key daily structure resistance. A candle close above confirmed the violation.
After a breakout, the broken resistance turned into a support.
Its test was a perfect point to buy the market from.
3. Buying / Selling the Market After Pullbacks
The third option is to trade the market after pullbacks.
However, remember that the market should be strictly in a trend .
In a bullish trend, the market corrects itself after it sets new higher highs. The higher lows usually respect the rising trend lines.
Buying the market from such a trend line, you open a safe trend-following trade.
In a bearish trend, after the price sets lower lows, the correctional movements initiate. The lower highs quite often respect the falling trend lines.
Selling the market from such a trend line, you open a safe trend-following trade.
On the chart above, we can see EURAUD pair trading in a bullish trend.
After the price sets new highs, it retraces to a rising trend line.
Once the trend line is reached, trend-following movements initiate.
What I like about these 3 setups is the fact that they work on every market and on every time frame. So no matter what you trade and what is your trading style, you can apply them for making nice profits.
❤️Please, support my work with like, thank you!❤️
I am part of Trade Nation's Influencer program and receive a monthly fee for using their TradingView charts in my analysis.

GOLD BUY SCALP EDUCATIONAL BREAK DOWN FOR LEARNERS LIVE TRADEGold prices are accelerating their daily decline, steadily approaching the critical $3,000 per troy ounce mark as the Greenback's rebound gains extra momentum and US yields tighten their retracement.


NFP BIG BULL SETUP BREAKOUT ALERT!🔥 Market Update for Traders! 🔥
Right now, the market is showing BEARISH momentum, and it's looking like we're heading for a dip. We could see the market fall and sweep the area around 3052 👀. Once that happens, expect a *huge* bounce back as the market could be getting ready to **shoot to the moon 🚀🌕!
🛑 KEY BUY LEVEL: 3130 - This is where you want to be ready to go long! 📈
🎯 First Target: Once we hit 3130, eyes on the ATH (All-Time High) for the retest! 🙌 And from there, we're eyeing a target at 3200 🚀🔥.
💥 NFP News Incoming! 💥
After Trump's speech, gold could *fall* around 1000 pips ⬇️, but **NFP could trigger a huge pump 📊💥. Stay sharp and trade with caution.
💡 Risk Management is KEY! Always follow your plan, set stop losses, and protect your capital. Don't let emotions drive your decisions! 📉🔑
Trade smart, stay sharp, and let's get those gains! 💸💥
#BearishMomentum #BullishReversal #RiskManagement #GoldPrice #NFPAlert

GOLD (XAUUSD): Bullish Rally ContinuesGold is currently experiencing a bullish trend and has reached a new all-time high on a 4-hour time frame.
After quite an extended bullish wave, the pair was consolidating within
a horizontal range for some time.
The resistance of this range was recently broken, indicating strong buyer strength.
I believe that the growth will likely continue, with the market potentially reaching the 3180 level in the near future.

Gold- Way, way too deviated from the MEAN!!!As I’ve mentioned many times in my analyses, my trading approach focuses on identifying the next big move (500 to 1,000 pips) rather than chasing small gains of 30-50 pips, which often feels more like staying busy than truly making money.
In this post, I’ll explain why I believe the next major move in Gold is downward rather than upward.
I’ll take a slightly different approach than usual, focusing on the bigger picture and using a simple 20-period moving average (MA) to smooth price action.
Looking at the posted chart, since the beginning of the recent bull market—highlighted in the chart at the 1,600 zone back in November 2022—Gold has been in a strong uptrend. A key observation is that the 20-period moving average has been forming higher lows.
After the second higher low in October 2023, the trend became even more aggressive, with only two notable higher lows since (looking on MA)—one in July 2024 and another in January 2025.
However, even during these sharp bullish legs, the market has consistently reversed to the mean—with the mean being the 20-period moving average.
At the time of writing, Gold is trading around 3,110, which is significantly deviated from the mean, currently around 2,990.
Conclusion:
Based on this pattern, we could expect either a deep retracement or at least a period of consolidation to allow the moving average time to catch up with the price.
Of course, shorting into such a strong bull run carries high risk, especially without a clear stop-loss level. However, even if Gold spikes to 3,150 or even 3,170, I strongly believe that the price will eventually drop and touch the 20-period moving average.
Disclosure: I am part of Trade Nation's Influencer program and receive a monthly fee for using their TradingView charts in my analyses and educational articles.

XAU/USD potential Longs from 2990 back up to 3,100This week, I’m considering both short- and long-term opportunities on gold. We’ve recently seen a change of character to the downside, and there’s a clean 1-hour supply zone that could trigger a short-term bearish reaction.
That said, there’s also a lot of nearby liquidity resting below, which I expect price to sweep first. If that happens, I’ll be watching the 20-hour demand zone—a strong area that could spark a new bullish rally from the lows.
Confluences for GOLD Buys:
- Price has recently cleared a new all-time high (ATH), indicating continued bullish strength.
- Market structure remains overall bullish, suggesting this move down may be a temporary correction.
- The 20-hour demand zone sits just below key liquidity and looks highly valid.
- Untouched Asia session highs remain above, which price is likely to target.
- The DXY is moving bearish, aligning with a bullish outlook on gold due to their inverse correlation.
Note: If price reacts from the current demand zone (which is also valid), we could see Scenario B play out first—a rally followed by a short move to clear liquidity before heading higher.
Stay patient and trade safe, everyone!

Gold toppedWe are bearish, aren't we?
With all the turmoil in the stock market (USA) caused by tarrifs (believed by the public)...
2 taps on the 0.702 fib retracement.
This is it.

Stable Awaiting US NF After Yesterday’s Crazy 2000 Pips Move🔔🔔🔔 Gold news:
➡️ The spot gold price struggled to maintain the $3,100 level during US trading, dropping from a new record high of $3,167.68. The XAU/USD pair surged during Asian trading hours yesterday as market participants panicked following the "Liberation Day" announcement by US President Donald Trump.
➡️ Financial markets were in turmoil amid speculation that inflation would soar while economic progress could stall. Concerns over a potential economic recession in the US grew, along with speculation that the Federal Reserve (Fed) might need to adjust its monetary policy accordingly. The US dollar dropped sharply, and stock markets around the world also declined.
Personal opinion:
➡️The drop in gold prices was mostly due to profit-taking by bulls after seeing the RSI of gold enter overbought territory and halting trading to monitor developments.
➡️Yesterday was a very rare crazy day when the gold price fluctuated up and down by 2000 pips.
➡️ Today the market will be slower and less volatile to wait for the NF news from the US to consider the new momentum to push the gold price. So watch the strong technical resistance - support zones to be able to make profits from them.
Resistance zone: 3113– 3137
Support zone: 3085 - 3070 - 3060
Plan:
🔆Price Zone Setup:
👉Buy Gold 3084- 3086 (Scalping)
❌SL: 3079 | ✅TP: 3090 – 3093 – 3100
👉Buy Gold 3058- 3060
❌SL: 3053| ✅TP: 3065 – 3070 – 3080
👉Sell Gold 3128- 3130 (Scalping)
❌SL: 3135 | ✅TP: 3124 – 3120 – 3116
👉Sell Gold 3065- 3067
❌SL: 3172| ✅TP: 3160 – 3155 – 3150
FM wishes you a successful trading day 💰💰💰

new era in gold...just sell gold!!!wave 5 of 5 of 5 has ended yesterday and its the time to sell gold...gold will fall heavily in next 6 month and we should just be selllllllller guys!!!its end of the buyer era!!!trump dump them badly

Gold ( XAUUSD ) Forecast for the next weekIf Gold stay at 3020 today than it will move up side again otherwise it will hit strong support of 3000 and than Gold start its rally again upside. Be patience and watch closely.
