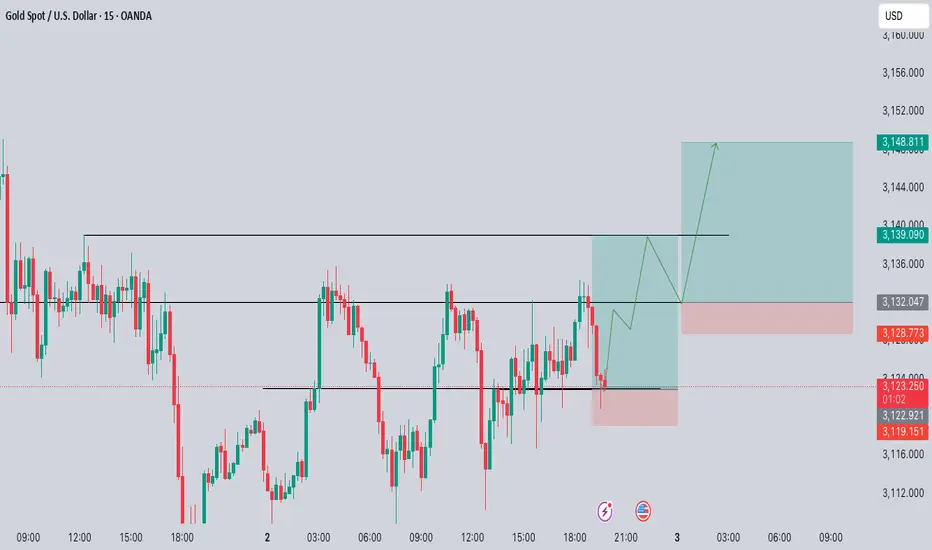
XAUUSD M30 NEW OUTLOOK XAUUSD M30 OUTLOOK
according to M30 analysis XAUUSD market is in falling pressure from few hours and now market almost at support level so wait for good opportunity market will be fly from support level
be careful use money management
TRADE AT YOUR OWN RISK
REGARD ALBERT
USCGC trade ideas

XAUUSD (Gold) is bearish scenario on Daily until 2,940.00 quote Hello guys and welcome one more time to my detailed yet simple strategies to make profit out of any situation in forex,
So, another month, another strategy, in fact, a modified strategy which I hope works better than my other previous 2 trades with simplified strategy. Maybe, it was too simple.
Let's go to the chart though. Daily chart is bearish, as I can see so we go to 15 min chart and seek for opportunity to sell.
So, from now on the next level to touch is a resistence point from March 25, 2025 which became a sort of support which is 3,070.00 and the next one stronger is 3,058.00.
So, let's see what happenes next.
You, what do you think?

GOLD Is Bullish! Buy!
Here is our detailed technical review for GOLD.
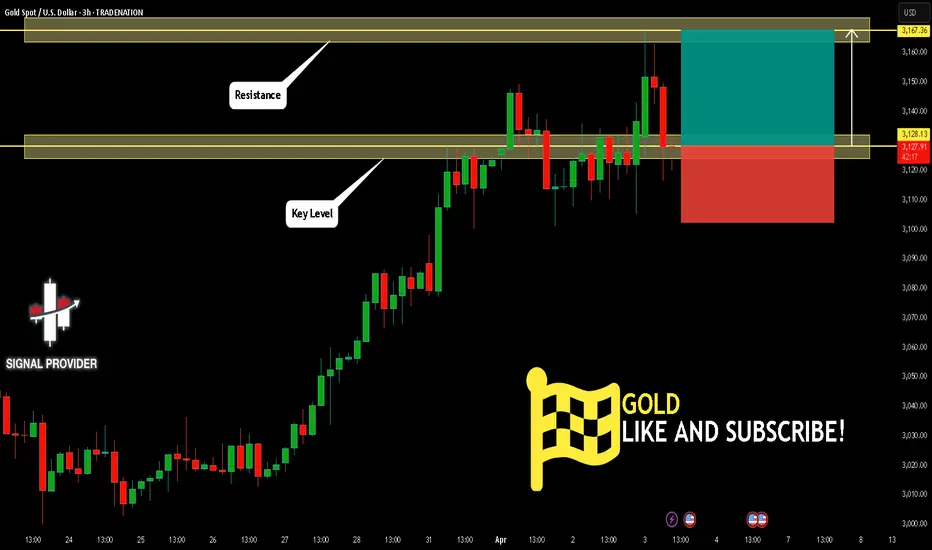
Time Frame: 3h
Current Trend: Bullish
Sentiment: Oversold (based on 7-period RSI)
Forecast: Bullish
The market is trading around a solid horizontal structure 3,128.13.
The above observations make me that the market will inevitably achieve 3,167.36 level.
P.S
We determine oversold/overbought condition with RSI indicator.
When it drops below 30 - the market is considered to be oversold.
When it bounces above 70 - the market is considered to be overbought.
Disclosure: I am part of Trade Nation's Influencer program and receive a monthly fee for using their TradingView charts in my analysis.
Like and subscribe and comment my ideas if you enjoy them!
Waiting for the right-side signal, gold prices are still in consDue to the relatively high tariffs signed by Trump, gold has experienced a significant rebound, with daily fluctuations approaching $100—volatility levels previously seen over the course of two weeks or even a month are now occurring within a few hours. After surging past $3000, the increased base has led to a dramatic rise in market volatility. While larger price movements may give the impression of easier profits, they also increase the risk of losses. As volatility rises, risk perceptions diminish, whereas human greed tends to escalate.
When daily fluctuations are limited to $10-20, the risks are minor, allowing for simpler directional trading, albeit with fewer opportunities. However, in the current environment, price changes of over $10 in just five minutes can trigger heightened greed, resulting in more frequent and varied trades. The unpredictability of market behavior complicates trading decisions. As humans, we tend to fear missing opportunities, leading us to enter trades impulsively. Conversely, when volatility decreases and waiting times lengthen, our desires tend to diminish, potentially increasing the chances of profitable trades.
Currently, testing the upper limits of gold prices is challenging as the market is under constant pressure to break higher. It’s essential to note key points: between 7-8 AM, we typically see a first wave of unrestrained upward movement. Observing market cycles is critical; in the last two days, we saw spikes during the European session followed by declines in the U.S. session, which then rebounded. If specific entry points are elusive, focus on cycles and the extent of previous corrections, identifying key timing for trades. For instance, yesterday exhibited a typical morning upward cycle, followed by a sustained upward trend during the European session that didn't break the previous highs, resulting in a lateral movement during the U.S. session.
Today, yet again, we are witnessing a 7-8 AM upward cycle with prices breaking above $3168. However, this pullback increases risks, particularly near the former double-bottom and the 618 retracement levels around $3130-32, which are crucial points to watch this afternoon. If there’s a continued upward move that breaks past the high, one should consider short entries if the price later retraces. A key observation must be made during the U.S. session, as recent pullbacks primarily occurred during this time. Following the morning's upward cycle, be vigilant of the 618 level and small double-bottoms; should there be a second rebound without breaking previous highs, consider going short during the U.S. session.
Although the broader trend lacks definitive signals of a peak, risks are inherently rising. In this environment, it’s important to heed the emphasized cycles of market behavior and timing. Increased volatility necessitates caution; avoid blindly chasing shorts or longs, and remain attuned to the market rhythm.

GOLD - Day Trading with RSI 04/02/2025
Weekly and Daily Timeframes (W & D):
GOLD is still in an uptrend, as the RSI's WMA45 is still hovering near the 70 level, and RSI remains above both of its moving averages.
H4 Timeframe:
This timeframe is currently showing a correction. However, it's not yet considered a downtrend because the WMA45 is still in the high region, close to the 70 level. But, RSI has dropped below the WMA45.
At present, the RSI on H4 is facing dynamic resistance from the WMA45 above and has support around the 4x level (43-48). The corresponding temporary price levels are approximately 3128 (resistance) and 3088 (support).
This end-of-uptrend correction on H4 could lead to high price volatility. GOLD may move within a 300–400 pip range (between the resistance from WMA45 and the RSI support around the 4x zone).
H1 Timeframe:
Currently in a downtrend, as RSI is moving below both of its MAs, and the WMA45 has a noticeable downward slope.
H1 also has RSI support at the 30 level (temporary price ~3086) and resistance at WMA45 above (temporary price ~3130).
Since we’re focusing on intraday trading, priority is given to the H1 trend.
Figure 1
Trading Plan: SELL
Entry Zone:
When RSI on M15 approaches upper resistance: levels 50–55 or 65–70.
Confirm Entry:
Conservative/Safe approach: when M5 ends its uptrend and reverses (see example in Figure 1 – M5 ends uptrend when RSI crosses below both MAs).
Or when bearish divergence appears on M5.
Or even earlier, when there’s divergence on M1 and M5's WMA45 flattens out.
Stoploss:
20–30 pips above M5’s recent peak.
Or if RSI on M5/M15 breaks through its previous high.
Take Profit:
100 pips or R:R >= 1:1.
Or when M5’s downtrend ends (when RSI crosses above both MAs).
You can check out the indicators I use here: www.tradingview.com

The long-short game of gold at high levels is intensifyingAfter continuing to rise, gold fell from its highs during yesterday's US trading session to test the 3100 integer support, and then stabilized and rebounded. After today's shock repair, the gold price finally stood above 3100, showing an overall strong trend. However, from the technical structure, the upward trend line at the hourly level has been broken, and the price has turned to horizontal horizontal operation, entering a high-level wide-range shock adjustment stage.
At present, gold is in a typical long-short stalemate, and the key resistance above is in the 3134-3127 area, which is both the previous high and an important top-bottom conversion pressure zone. If this resistance area can be effectively broken, the gold price is expected to further test the 3150 mark. The primary support below is the 3105-3113 range. The gains and losses in this area will determine the short-term long-short trend. If this support is lost, it may trigger a deeper correction, testing key support levels such as 3085 and 3070-3065 in turn.
Although gold has shown initial signs of stagflation, it is recommended to still take the low-long strategy as the main idea and the high-short strategy as the auxiliary before the short trend is clearly formed. In terms of specific operations, short orders can be arranged in the 3134-3140 area, with the stop loss set above 3150, the target is 3115, and further down to the 3100 mark; at the same time, long orders can be tried in the 3100-3105 area, with the stop loss set below 3090, and the targets are 3130 and 3150 respectively.
The current market is at a critical turning point. Investors need to pay close attention to the breakthrough direction of the wide range of 3100-3150, and pay attention to controlling positions, strictly stop losses, and guard against sudden volatility risks. Before the trend becomes clear, it is recommended to maintain flexible operations and avoid excessive pursuit of gains and losses.
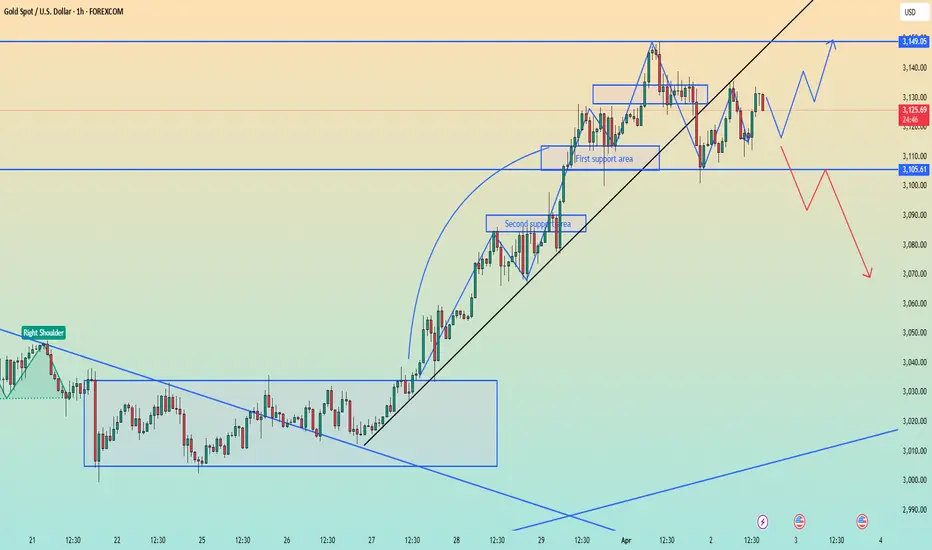
Gold Potential Bullish ContinuationWith widespread panic about tariffs, Gold price still seems to exhibit signs of overall Bullish momentum as the price action may form a credible Higher Low with multiple confluences through key Fibonacci and Support levels which presents us with a potential long opportunity.
Trade Plan:
Entry : 3131
Stop Loss : 3095
TP 1 : 3167

XAU/USD Gold Bullish Momentum – Targeting $3,153+?📊 XAU/USD Daily Analysis – Bullish Continuation in Ascending Channel
🔹 Market Structure & Trend Analysis
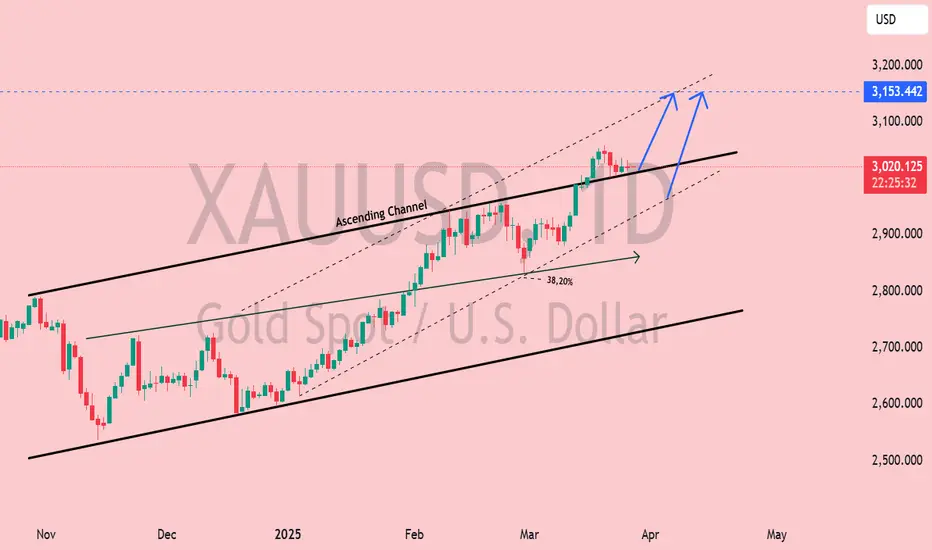
Gold (XAU/USD) remains in a well-defined ascending channel, respecting both dynamic support and resistance levels. The trend remains bullish, with higher highs and higher lows forming since late 2024. Currently, price is trading near the upper boundary of the channel, suggesting strong bullish momentum.
🔹 Key Technical Levels
Resistance Zone: $3,153 – $3,200 (potential breakout target)
Current Price: $3,020 (holding above key mid-range support)
Support Levels:
Channel Midline Support: ~$2,980
38.2% Fibonacci Retracement: ~$2,900 (potential corrective zone)
Channel Bottom Support: ~$2,700 (strong demand area)
🔹 Bullish Scenario 🟢
A break and close above $3,153 would confirm a bullish breakout, opening the door for a rally toward $3,200 and beyond.
Momentum remains strong, with price structure favoring continued upside as long as it stays above the midline of the channel.
🔹 Bearish Scenario 🔴
Failure to break above $3,153 could trigger a short-term pullback toward $2,980 - $2,900, where buyers may re-enter.
A confirmed breakdown below the ascending channel would invalidate the bullish setup and expose $2,700 - $2,600 as potential downside targets.
🔹 Conclusion & Trade Considerations
Bias: Bullish as long as price remains inside the ascending channel.
Entry Considerations: Retest of $3,020 - $2,980 as support could offer a high-probability long setup.
Breakout Confirmation: A daily close above $3,153 strengthens the bullish case for continuation.
Hanzo | Gold 15 min Breaks – Will Confirm the Next Move🆚 Gold
The Path of Precision – Hanzo’s Market Strike
🔥 Key Levels & Breakout Strategy – 15M TF
🔥 Deep market insight – no random moves, only calculated execution.
☄️ Bearish Setup After Break Out – 3111 Zone
Price must break liquidity with high volume to confirm the move.
☄️ Bullish Setup After Break Out – 3136 Zone
Price must break liquidity with high volume to confirm the move.
🩸 15M Time Frame Confluence
————
CHoCH & Liquidity Grab @ 3142
Key Level / Equal lows Formation - 3111
Strong Rejection from 3149 – The Ultimate Pivot
Strong Rejection from 3100 – The Ultimate Pivot
🔥 1H Time Frame Confirmation
Twin Wicks @ 3136 – Liquidity Engineered
Twin Wicks @ 3127 – Liquidity Engineered
☄️ 4H Historical Market Memory
——
💯 31 march 2025 – bearish Retest 3126
💯 31 march 2025 – bearish Retest 3126
💯 1 april 2025 – Liquidity Grab Range 3118 : 3126
💯 1 april 2025 – Bullish Retest At 3126 : 3130 Zone
👌 The Market Has Spoken – Are You Ready to Strike?

XAUUSD Buy ideaI mean shit buy if you want I’m no financial advisor but I’ve been successful with this strategy for quite a while so it’s pretty simple #Keep Trading simple again
Gold trend goes up.
Entry on:
15m-1h TF discount zone
15m OB
once the price breach 3130 zone, planning to add buy position on pullback.
Online real-time guidance on gold trendsGold went up in the early trading, but the price fell again after rising to 3135. The fluctuation range of European trading narrowed. ADP employment data exceeded expectations. The market failed to break out of the trend. The current market is in the range of 3135-3109. The market is waiting for the details of the reciprocal tariffs and industry-specific tariffs to be announced at 3 am. The tariff policy announced by Trump is expected to have an adverse impact on the global economy, especially the United States. The current structure of gold is still bullish. After the correction, continue to go long at the key support level.
At the 4-hour level, the current market is shrinking and oscillating at a high level. The K-line is running above the middle track, and the oscillating and strong trend is maintained above the middle track. Focus on the 3100 support break. Only when it breaks below 3100 will the downward space be opened. There can be more at 3080-3060 below, and only when it stands above 3135 can it further hit a new high. Before the data, continue to see range oscillation, the small range is 3110-3135, and the large range is 3100-3150. In the short term, you can quickly enter and exit in the small range with high altitude and low long.

Some history....GOLD HISTORY:
1970 TO 1980:
Gold has a strong bubble rise that falls 50% when it breaks.
2001 to 2011:
10 year up trend
Gold rises further with virtually no setbacks until 1919, but then collapses to $1019.
2015 to 2025:
10 year up trend still at the moment.
The gold price has increased from $1019 in December 2015 to well over $3155 today without serious dips or pullbacks. It is easy to see why this attracts investors, especially when compared to the turbulence in the stock market over the same period of time. It is also easy to see why people might expect that gold will continue to rise after watching it gain consistently for well over a decade.
However, history shows that asset prices cannot continue to go up indefinitely. There are always pull backs, crashes, and bear markets. The last time this happened to gold is a distant memory, but we all remember recent examples such as the tech stocks in the '90s and home prices in the '00s.
Now, lets see Elliot wave principle. When an extending wave 5 ends ( we are at one at the moment), we will see a swift correction down to sub wave 2 of this wave 5. So, the opportunity presents in two ways. First, we know it will be a rapid correction, which means we will not have to wait long for realizing our profits. Secondly, we know approximately how far the down move will likely travel.
At this moment , we are looking for the same escenario as 2008. Wave 3 travels 5.618 from wave 1, then wave 4 made a correction to the 38.2% zone, and finally wave 5 was equal to the entire previous 1-3 movement. This is what is happening right now as welll.
It is always easier to identify assets that are bubbling than to predict when the bubble will pop. Gold has much more downside than upside at this point, but this has been true for years without slowing price gains. Home prices and tech stocks also suggest that bubbles can exist for years even after objective measures (e.g. P/E ratios or rent to buy ratios) show that markets are out of equilibrium.
It is anybody's guess when gold will correct, but it is very likely that it will be ugly when it does.

NFP & Unemployment Rate Preview – April 4, 2025📉 NFP & Unemployment Rate Preview – April 4, 2025 🧨
Today traders will be waiting for one of the most overhyped news releases of the month — Non-Farm Payrolls (NFP). Buckle up for some wild swings, maybe even caused by… 10 fewer McDonald’s hires. 🍔💥
🧠 What’s Expected?
Jobs added: Around 135K, down from 151K.
Unemployment rate: Steady at 4.1%.
Average hourly earnings: Expected +0.3% MoM, +4.0% YoY.
🧨 What’s brewing?
Trump’s new import tariffs (yes, again) are shaking markets, pushing fears of inflation and recession to the surface.
Economic data has been mixed — some cracks are showing, and traders are ready to overreact either way. 🙃
🎙 Powell speaks — so if NFP doesn’t move the market, maybe a few carefully chosen Fed words will.
😏 Reminder for the impatient ones:
If the first 5-minute candle after NFP doesn’t go your way… maybe wait for the second one before tweeting “market is broken.” 🫠📉
#NFP #XAUUSD #Forex #Powell #GoldScalping #FOMC #VolatilityDay #PatienceNotPanic


Gold reaches the dynamic supportGold has been overbought technically, which was visible from RSI (it was flashing the overbought conditions positioning above the 70 point line), Bollinger Bands (price was spiking above the 2 standard deviation zone), and the price action: after the initial breakout, it was rapidly sold off not holding the buying pressure anymore.
So, the most expected scenario was probably a consolidation or a correction. As we see now, the scenario of correction was triggered.
As Gold served both as a protection, and as a growth vehicle, it's difficult to assume the further liquidation. The most expected scenario would be a bullish pivot and locking in a consolidation, as shown at the chart.
Don't forget - this is just the idea, always do your own research and never forget to manage your risk!
