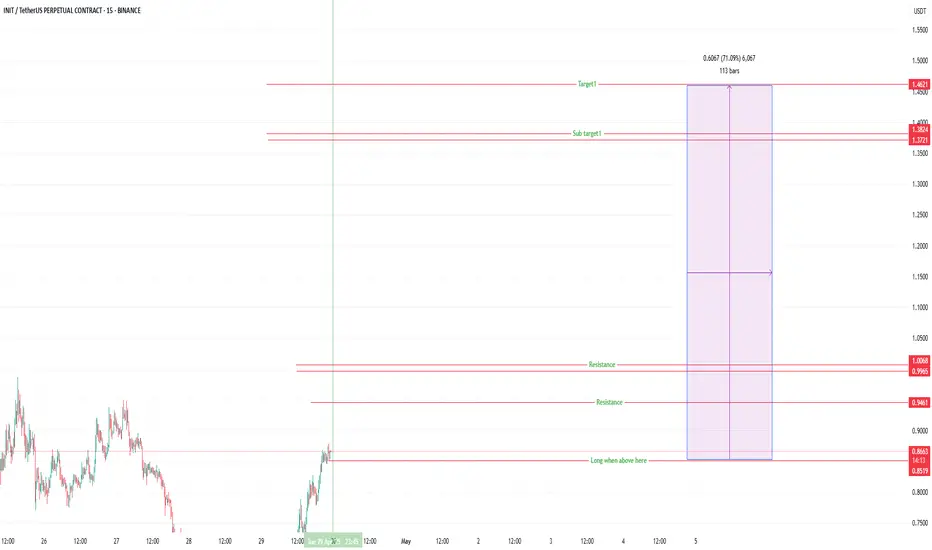
Get ready for big bull.It look like it is not time to buy INIT.
Look for good entry.
Use proper management.
Take small profit.

$INIT Bearish Trend ConfirmationAnalysis: OMXSTO:INIT is forming lower highs on the 4H chart, confirming a bearish trend below $0.85. The CCI is at -120, indicating oversold conditions, but no bullish reversal is visible. Short on a retest of $0.84, targeting $0.77, with a stop-loss at $0.86.
Key Levels: Resistance: $0.84, $0.86

$INIT High Volatility Signals CorrectionAnalysis: OMXSTO:INIT ’s 24.5% daily range indicates extreme volatility, with the price at $0.85 showing no follow-through after a recovery. The 4H MACD is bearish, and the Parabolic SAR flipped above the price. Short at $0.85, targeting $0.78, with a stop-loss at $0.87.
Key Levels: Resistance: $0.

$INIT Showing Weakness Below $0.85Analysis: OMXSTO:INIT ’s momentum is fading, with the price slipping below $0.85 and the 1H Bollinger Bands contracting, signaling low volatility before a drop. The ADX is weakening (20), showing no trend strength. Short at $0.84, targeting $0.79, with a stop-loss at $0.86.
Key Levels: Resistance:

$INIT Bearish Setup on Resistance RejectionAnalysis: OMXSTO:INIT failed to break $0.85, forming a bearish pinbar on the 2H chart. The Stochastic RSI is dropping from overbought (85), and open interest is rising, indicating short pressure. Short at $0.84, targeting $0.80, with a stop-loss at $0.86.
Key Levels: Resistance: $0.85, $0.86 | Sup

$INIT Testing Critical Support BreakdownAnalysis: OMXSTO:INIT is struggling to hold the $0.85 level, with a 4H chart showing a breakdown below the 20-day EMA ($0.84). The RSI is oversold at 23, but no reversal candle has formed. Short on a retest of $0.84, targeting $0.77, with a stop-loss at $0.86.
Key Levels: Resistance: $0.84, $0.86

$INIT Risks Pullback After Volatile SpikeAnalysis: OMXSTO:INIT ’s 24H volume spiked to 673M, but the price failed to hold above $0.85, suggesting distribution. The 1H chart shows a bearish engulfing candle, and the MACD is crossing bearish. Short at $0.84, targeting $0.78, with a stop-loss at $0.87.
Key Levels: Resistance: $0.85, $0.87 |

$INIT Overbought with Bearish DivergenceAnalysis: OMXSTO:INIT ’s rapid rise to $0.85 has pushed the 4H RSI to 75, indicating overbought conditions. A bearish divergence is visible, with lower RSI highs despite price peaks. The price is stalling below the 61.8% Fibonacci retracement ($0.86). Short at $0.85, aiming for $0.79, with a stop-l

$INIT Faces Rejection at $0.9 ResistanceAnalysis: OMXSTO:INIT has been rejected twice at $0.9, forming a double-top pattern on the 1H chart. The RSI is showing divergence, dropping to 55 while price remains flat, signaling weakening momentum. A bearish MACD crossover is forming. Short below $0.84, targeting $0.80, with a stop-loss above

See all ideas
Summarizing what the indicators are suggesting.
Oscillators
Neutral
SellBuy
Strong sellStrong buy
Strong sellSellNeutralBuyStrong buy
Oscillators
Neutral
SellBuy
Strong sellStrong buy
Strong sellSellNeutralBuyStrong buy
Summary
Neutral
SellBuy
Strong sellStrong buy
Strong sellSellNeutralBuyStrong buy
Summary
Neutral
SellBuy
Strong sellStrong buy
Strong sellSellNeutralBuyStrong buy
Summary
Neutral
SellBuy
Strong sellStrong buy
Strong sellSellNeutralBuyStrong buy
Moving Averages
Neutral
SellBuy
Strong sellStrong buy
Strong sellSellNeutralBuyStrong buy
Moving Averages
Neutral
SellBuy
Strong sellStrong buy
Strong sellSellNeutralBuyStrong buy