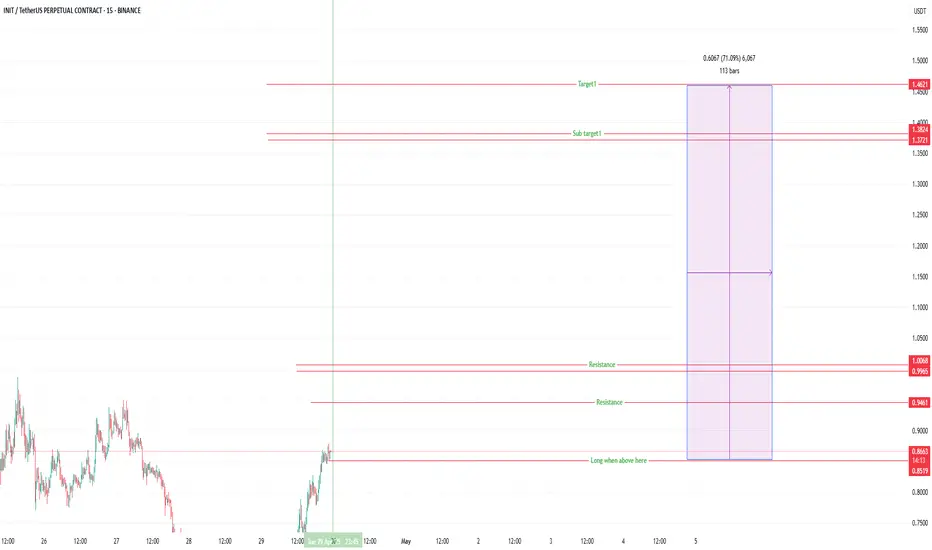
Get ready for big bull.It look like it is not time to buy INIT.
Look for good entry.
Use proper management.
Take small profit.

$INIT Bearish Trend ConfirmationAnalysis: OMXSTO:INIT is forming lower highs on the 4H chart, confirming a bearish trend below $0.85. The CCI is at -120, indicating oversold conditions, but no bullish reversal is visible. Short on a retest of $0.84, targeting $0.77, with a stop-loss at $0.86.
Key Levels: Resistance: $0.84, $0.86

$INIT High Volatility Signals CorrectionAnalysis: OMXSTO:INIT ’s 24.5% daily range indicates extreme volatility, with the price at $0.85 showing no follow-through after a recovery. The 4H MACD is bearish, and the Parabolic SAR flipped above the price. Short at $0.85, targeting $0.78, with a stop-loss at $0.87.
Key Levels: Resistance: $0.

$INIT Showing Weakness Below $0.85Analysis: OMXSTO:INIT ’s momentum is fading, with the price slipping below $0.85 and the 1H Bollinger Bands contracting, signaling low volatility before a drop. The ADX is weakening (20), showing no trend strength. Short at $0.84, targeting $0.79, with a stop-loss at $0.86.
Key Levels: Resistance:

$INIT Bearish Setup on Resistance RejectionAnalysis: OMXSTO:INIT failed to break $0.85, forming a bearish pinbar on the 2H chart. The Stochastic RSI is dropping from overbought (85), and open interest is rising, indicating short pressure. Short at $0.84, targeting $0.80, with a stop-loss at $0.86.
Key Levels: Resistance: $0.85, $0.86 | Sup

$INIT Testing Critical Support BreakdownAnalysis: OMXSTO:INIT is struggling to hold the $0.85 level, with a 4H chart showing a breakdown below the 20-day EMA ($0.84). The RSI is oversold at 23, but no reversal candle has formed. Short on a retest of $0.84, targeting $0.77, with a stop-loss at $0.86.
Key Levels: Resistance: $0.84, $0.86

$INIT Risks Pullback After Volatile SpikeAnalysis: OMXSTO:INIT ’s 24H volume spiked to 673M, but the price failed to hold above $0.85, suggesting distribution. The 1H chart shows a bearish engulfing candle, and the MACD is crossing bearish. Short at $0.84, targeting $0.78, with a stop-loss at $0.87.
Key Levels: Resistance: $0.85, $0.87 |

$INIT Overbought with Bearish DivergenceAnalysis: OMXSTO:INIT ’s rapid rise to $0.85 has pushed the 4H RSI to 75, indicating overbought conditions. A bearish divergence is visible, with lower RSI highs despite price peaks. The price is stalling below the 61.8% Fibonacci retracement ($0.86). Short at $0.85, aiming for $0.79, with a stop-l

$INIT Faces Rejection at $0.9 ResistanceAnalysis: OMXSTO:INIT has been rejected twice at $0.9, forming a double-top pattern on the 1H chart. The RSI is showing divergence, dropping to 55 while price remains flat, signaling weakening momentum. A bearish MACD crossover is forming. Short below $0.84, targeting $0.80, with a stop-loss above

See all ideas