IOTAPERP trade ideas


SHORT: IOTA Too Far Too Fast IOTA moved too far too fast on Chrysalis update news. Look for rapid reversal short trade. IMO.

IOTA (MIOTA) - April 19Hello?
Dear traders, nice to meet you.
By "following" you can always get new information quickly.
Please also click "Like".
Have a good day.
----------------------------------
(IOTAUSD 1W chart)
(1D chart)
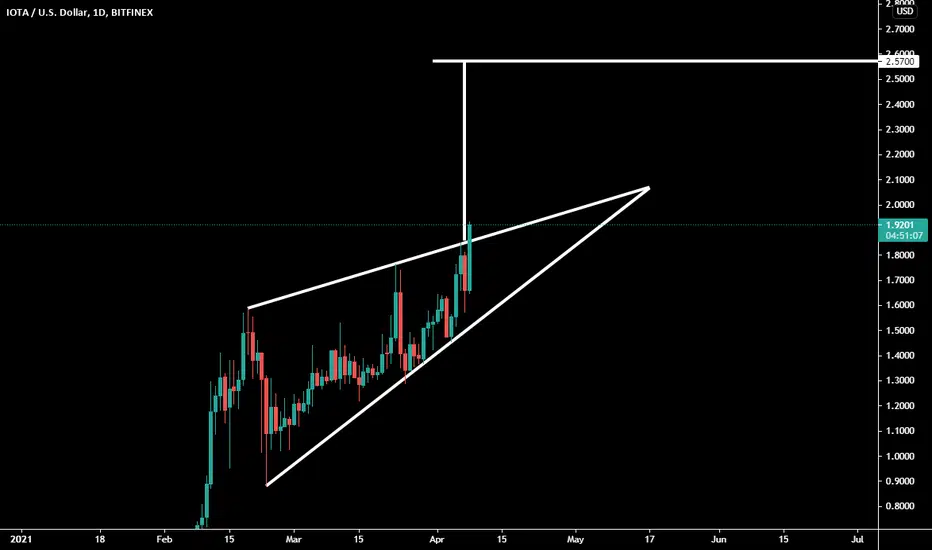
You should watch for any movement that deviates from the 2.18657391-2.41735783 section.
If you go down at 2.03351702, you need a short stop loss.
However, it may rise along the uptrend line, so careful trading is necessary.
It remains to be seen if the uptrend can continue, breaking above the critical point of 2.49603989.
The next volatility period is around April 23rd.
-----------------------------------
(IOTABTC 1D chart)
We must see if we can rise above the 4221 Satoshi point and gain support.
If it falls, it remains to be seen if it can gain support at the 3555 Satoshi spot and move up along the uptrend line.
-------------------------------------------------- -------------------------------------------
** All indicators are lagging indicators.
So, it's important to be aware that the indicator moves accordingly with the movement of price and volume.
Just for convenience, we are talking upside down for interpretation of the indicators.
** The wRSI_SR indicator is an indicator created by adding settings and options from the existing Stochastic RSI indicator.
Therefore, the interpretation is the same as the conventional stochastic RSI indicator. (K, D line -> R, S line)
** The OBV indicator was re-created by applying a formula to the DepthHouse Trading indicator, an indicator that oh92 disclosed. (Thank you for this.)
** Check support, resistance, and abbreviation points.
** Support or resistance is based on the closing price of the 1D chart.
** All explanations are for reference only and do not guarantee profit or loss on investment.
Explanation of abbreviations displayed on the chart
R: A point or section of resistance that requires a response to preserve profits
S-L: Stop Loss point or section
S: A point or segment that can be bought for profit generation as a support point or segment
(Short-term Stop Loss can be said to be a point where profits and losses can be preserved or additionally entered through installment transactions. It is a short-term investment perspective.)
GAP refers to the difference in prices that occurred when the stock market, CME, and BAKKT exchanges were closed because they do not trade 24 hours a day.
G1: Closing price when closed
G2: Cigar at the time of opening
(Example) Gap (G1-G2)


IOTA USDJust going to hold my trade-long here as long as the parabol supports us and if we rocket on the first one I am going to look the 2nd one for later to buy back.

IOTA at important long-term resistance#IOTA - Look on this weekly $IOTA Chart - we are reaching an important long term resistance now. As soon as we reach a very important long-term resistance, the price drops. We need a takeover of this level at $2.81 to start heading to the ATH.


IOTA 140 $ LONG TERMIs IOTA 140 dollar price target crazy to call ?
No , just by reading the chart it's easy what it did at the bottom; a 10 x and it will be more epic when it will be forming the U-form and do back a 10 x.
Do you think I am crazy or just realistic view ?
I would like to read your comments and to hear from you.
Peace

4.57R IOTAUSD Target Price 2.78915533IOTAUSD Reward Risk 4.57, 4.28 Lotsize
Meta Trader 4 Terminal
4568.90 USD Reward
0999.38 USD Risk
4.57 R-Multiple


IOTUSD Can't go beyond the 0Hi there.
IOTUSD is coming close to the bottom. It can not go beyond the 0 USD
How to trade on this chart.
1. Price is still in bearish trend Watch 0.20 or 0.10 for reversal. The lower the price goes then better the opportunity will be.
Or
2. Wait for the whole crypto market to hold bottom and wait for the 1st impulse from the bottom and then go for buy.
Please support the setup with your likes, comments and by following on Trading View thanks
Good Luck

IOTA: Another movement coming soonPrice is accumulating between 1.1 and 1.7 for a while. In 3D timeframe we can see clear wedge pattern and also RSI is close to the support on uptrend line.
So all in all:
- Any daily close between $1.8- $1.9 will confirm that another strong bull run is around the corner
- There can be one last downward leg to $1.4 level before we see green candles on 3D timeframe. You can tell this with checking how price reacts when it touches to the upper - lower trend line inside the wedge.
When the price breaks $1.8-$1.9 zone, there is no reason to not hit $5 in a very short term.

IOTA (MIOTA) - April 8 Hello?
Dear traders, nice to meet you.
By "following" you can always get new information quickly.
Please also ask for the "Like" clock.
Have a nice day.
----------------------------------
You should watch for any movement that deviates from the 1.4942213-1.84039802 section.
In particular, it remains to be seen if it can gain support at 1.55251884 and climb along the uptrend line.
We have to see if we can get support by climbing to the 1.84039802-1.95578998 range.
If you fall from the 1.49422213 point, you need a short stop loss.
However, you need to trade carefully as you can touch the 1.29319710 point or the uptrend line and move up.
If it falls in the 1.03265428-1.14804624 interval, a Stop Loss is required to preserve profit and loss.
If the CCI line falls below 100 on the CCI-RC indicator, there may be volatility and you need to trade carefully.
It remains to be seen if the CCI line can break above the EMA line and continue the uptrend.
-------------------------------------
(IOTABTC 1D chart)
2889 Satoshi-3555 We must watch for any movement that deviates from the Satoshi section.
If it falls, we need to make sure we get support in the 2667 Satoshi-2889 Satoshi section.
If you fall at 2566 Satoshi, you need a short stop loss.
If it falls at 2222 Satoshi, Stop Loss is needed to preserve profit and loss.
-------------------------------------------------- -------------------------------------------
** All indicators are lagging indicators.
So, it's important to be aware that the indicator moves accordingly with the movement of price and volume.
Just for the sake of convenience, we are talking upside down for interpretation of the indicators.
** The wRSI_SR indicator is an indicator created by adding settings and options from the existing Stochastic RSI indicator.
Therefore, the interpretation is the same as the conventional stochastic RSI indicator. (K, D line -> R, S line)
** The OBV indicator was re-created by applying a formula to the DepthHouse Trading indicator, an indicator published by oh92. (Thank you for this.)
** Check support, resistance, and abbreviation points.
** Support or resistance is based on the closing price of the 1D chart.
** All explanations are for reference only and do not guarantee profit or loss on investment.
Explanation of abbreviations displayed on the chart
R: A point or section of resistance that requires a response to preserve profits
S-L: Stop Loss point or section
S: A point or segment that can be bought for profit generation as a support point or segment
(Short-term Stop Loss can be said to be a point where profits and losses can be preserved or additionally entered through installment transactions. It is a short-term investment perspective.)
GAP refers to the difference in prices that occurred when the stock market, CME, and BAKKT exchanges were closed because they are not trading 24 hours a day.
G1: Closing price when closed
G2: Cigar at the time of opening
(Example) Gap (G1-G2)

IOTA, Got the LegsIOTA, 3D, significant break and backtest of 1.41 completed. All momo oscs keeping bullish posture, MACD renewed green on current candle. Entry at or below 1.50 maintains 3:1 R:R on first target - slow and low, time will tell.

It's time for IotaHello guys
If you waiting for growth you have to wait for brakeout white line and confirmation then we have to big chance to pump IOTA. Let's see and be patient.
Good luck friends!
Address for donation:
LTC:
MRkwgSCQz44zqM7Bb1cYdhYQcHQYD8GoEi

IOTA: Ascending Triangles everywhere! – 1HAnother Ascending triangje, this time on the 1H. Target $1.75

IOTA: A new Dawn - I'm calling it!What do you think guys, am I too bullishin this idea? Anyhow soon (TM) we will see!
For outsiders, check out IOTA's biggest update so far: blog.iota.org

IOTA Next Moves (Long term)If we broke the red resistance area, most likely will see the 2017 bull run moves playing out
