Don't miss the great buy opportunity in IOTUSDTrading suggestion:
. There is a possibility of temporary retracement to suggested support line (0.2118). if so, traders can set orders based on Price Action and expect to reach short-term targets.
Technical analysis:
. IOTUSD is in a range bound and the beginning of uptrend is expected.
.The price is above the 21-Day WEMA which acts as a dynamic support.
. The RSI is at 70.
Take Profits:
TP1= @ 0.2975
TP2= @ 0.3680
TP3= @ 0.5537
SL= Break below S2
IOTAPERP trade ideas

Don't miss the great buy opportunity in IOTUSDTrading suggestion:
. There is a possibility of temporary retracement to suggested support line (0.2118). if so, traders can set orders based on Price Action and expect to reach short-term targets.
Technical analysis:
. IOTUSD is in a range bound and the beginning of uptrend is expected.
.The price is above the 21-Day WEMA which acts as a dynamic support.
. The RSI is at 70.
Take Profits:
TP1= @ 0.2975
TP2= @ 0.3680
TP3= @ 0.5537
SL= Break below S2

The next targetSupport tested successfully. The next target is shown on the chart.
We are slowly moving towards the long-term goal which you can see at the link below.


IOTUSD Breakout To The Upside! IOTUSD Breakout To The Upside! Retested previous resistance trendline and now testing @0.21$. Target: ~ 0.24$.


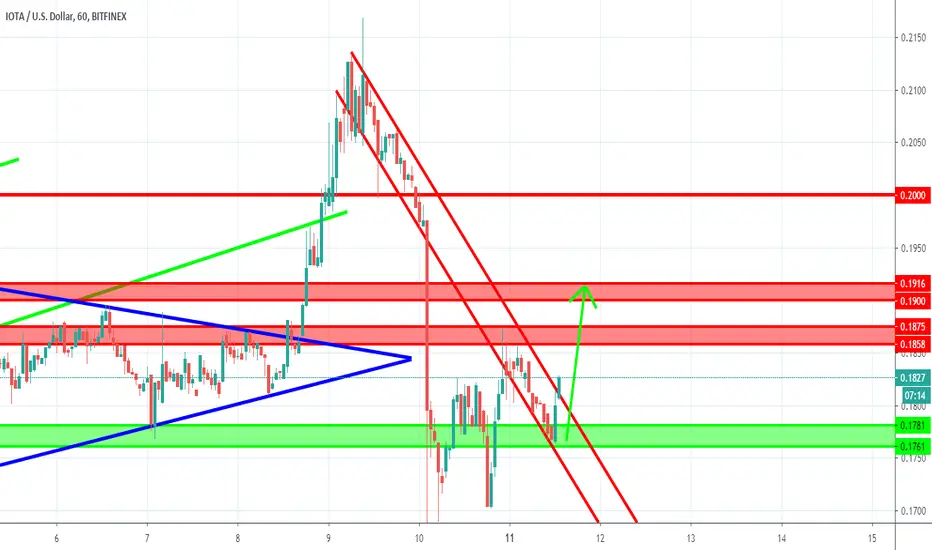
IOTUSD Falling Wedge Up To 0.2$?! Support tested...IOTUSD Falling Wedge Up To 0.2$?! Support tested...

IOTA on life supportCan't breath on it's own, put on a fed bailout respirator,regardless the patient's prognosis is dire: Bear flagging into major support now turned resistance and accumulating bearish divergences. Classic stairway up elevator down. By January 2021, IOTA will be delisted.
I have extremely neutral view on iota and don't hold any position, I just read what the chart is telling me and this is one of the worst Alts chart.

IOTUSD Entering Critical Zone...IOTUSD Entering Critical Zone... 0.2060 Fibonacci AND VPVR PoC. Price Drop to Support Zone (0.1975 Fibonacci/0.2$ Support) possible...


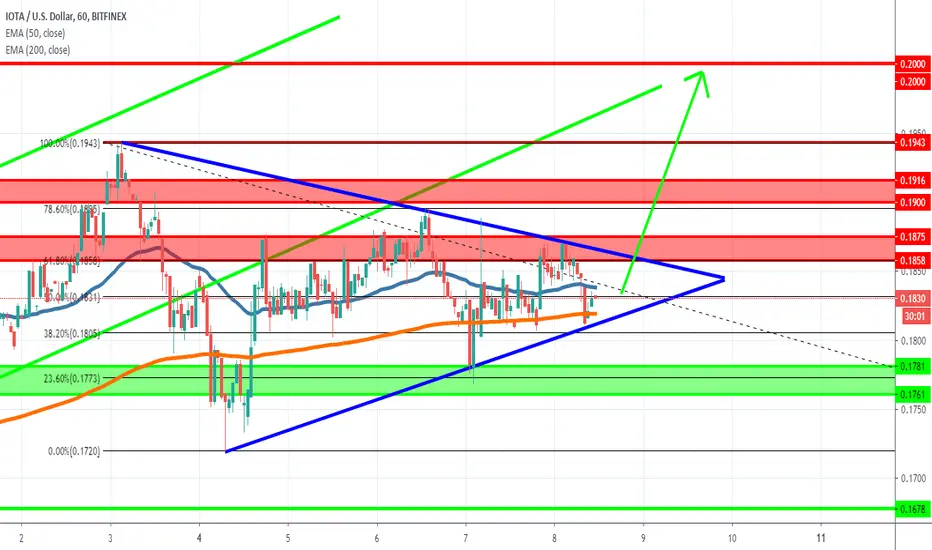
IOTUSD Scenarios...IOTUSD Scenarios... We broke the rising wedge to the upside and retestet a few times. SCENARIO 1: We break the resistance @~0.21$. SCENARIO 2: We fall back into the rising wedge and go down to ~0.19$ SCENARIO 3: We fall back into the rising wedge, go down to 0.2$ and bounce up, back to 0.21$.


IOTUSD Up To Resistance?!IOTUSD Up To Resistance?! IOTUSD formed a downtrend and fall out of it and is now back in... possible raise up to resistance (maybe even back up @0.2$ if bitcoin tries to break 10k again...)
IOTAUSDRejection from 200 MA, entry is just below daily close. Target is the daily ATR average. Stop is just above body of prior daily candle (09/05/2020). Good luck to all. Not advice.

IOTA DOLLAR - STRONG 50% GAINS ON THE DAILYDAILY CROSS
ROOM TO GROW 50% TO TREND LINE
TRADE ACTIVE BITFINEX:IOTUSD

IOTAUSDOne hour timeframe. Ichimoku long signal and the formation of a cup and handle pattern. C&H normally respects the 1.272 Fibonacci level.

IOTUSD Unstoppable! Huge Breakout!!!IOTUSD Unstoppable! Huge Breakout!!! Bursts through Resistance... Target @0.2$ AND than BIG Resistance...

IOTA Bullish SignsHey Guys:
BINANCE:IOTAUSD is our next coin of discussion. I'm a big fan of their work.
Not only am I a big fan of their work, but I'm also a big fan of their W and 1D charts. Most of my ideas will be with a long-term mindset.
Please remember that these are just my opinions. I'm always open to discussion on the ideas and what I'm talking about.
Entry Point:
I'm slowly accumulating more and I'll be keeping that strategy. Just looking for good opportunities.
I think we're safe to buy until the ~$.80 b/c it'll face some resistance at $1.
I make this statement with two assumptions:
that the resistance faced September of 2018, which is marked with the red arrow, will not be an issue for us, and
The breakthrough of the 1 Fib level on the 1D chart will give us some challenges but we'll eventually overtake it.
If it can cleanly pass the $1 - $1.10, we're safe until around $1.35 - $1.40. It'll face some resistance at the 0.236 Fib level. Then we can just rinse and repeat those steps for each Fib ( How to use the Trend-Based Fib Extension ). I'll be updating the comments as this unfolds. It should be fun.
Target Points:
(1) 1.7
(2) 2.67
(3) 3.44
(4) 4.20 (nice)
(5) 5.28
Stop-Loss:
We'll have to wait to see if $0.20 can hold. If not, we'll turn this into a selling game.
Indicators:
Weekly
FIbonacci
The Trend-Based Fib Extension is used to guage potential support/resistance levels after we've gone through a correction of the previous trend. This is where the Price Points are taken from.
Moving Averages
Our 50-MA (blue) has had enough data to take its trend into consideration when making a purchase order. It's starting to smooth out its downtrend which could indicate a change of direction. We'll have to watch as this develops.
If the 20-EMA (orange) can hold above the 50-MA for a bit, we'd be in a good spot.
Sniper T3-CCI
Waiting for this to move above the line could be the conservative play here.
Volume
The sell volume seems to be getting smaller. Let's look for a spike one of these weeks to indicate some direction.
Candlesticks
I like using the Heikin Ashi candle to gauge trends.
Summary
There's a bunch of information here. But the most important thing is that we're thinking long-term. Well into and past next year. We'll update price points as this unfolds but for now, we're looking to lock in some profits between now and the ~$1.4 mark.
Good Luck!
-Matt

IOTUSD Breaking Downtrend Up To Resistance?!IOTUSD Breaking Downtrend Up To Resistance?! Seems like 0.1805 Fibonacci holds...

