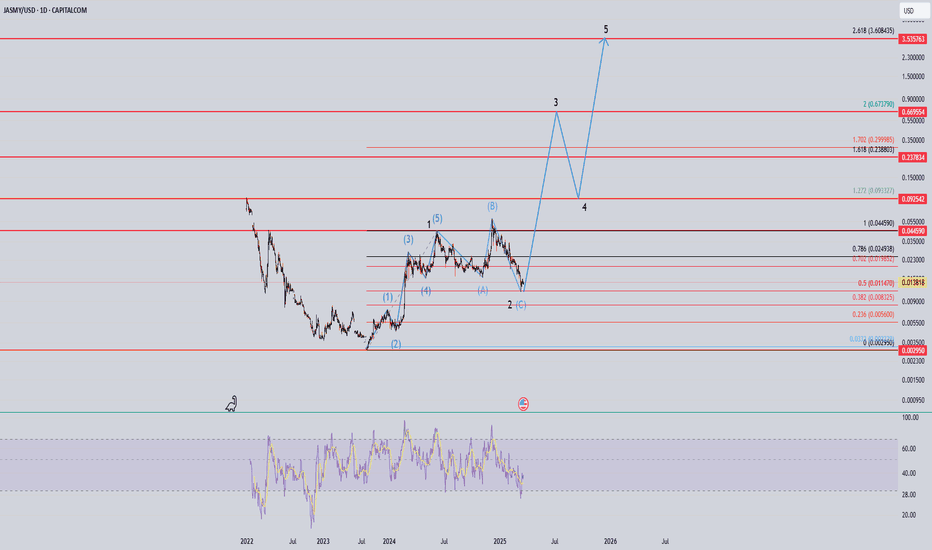
Daily chart bullish As a daily chart, we almost breaking out from the trend line, but we are not confirmed the break through yet unless we breakout that resistance at 0.018
if that breakout happen, we then confirmed we going to see a very nice bull run until December 2025, expected price to reach 0.03
I hope the it m
(JASMY) jasmy "sectioned macd - wave phase"As seen between the purple lines are the phases of the MACD with no overlap between each of the purple lines. The final bottom phase(5) was reached at which point the price rose to an astonishing 75%. Not sure if these purple lines will be of much use from here on out. I may delete them at some poin
(JASMY) jasmy "cycle-phase-wave"According to an enhanced MACD indicator that follows three layers of information I found the peak MACD green to line up with the yellow lines on the chart that are assigned with the next alternative colored line to be aligned with the most recent improvement in the otherwise losing price for the las
JASMY aiming at $0.10 after this break out!JasmyCoin / JASMYUSD is posting a massive green 1week candle, the strongest one since the December 2nd 2024 that formed the high of this Cycle so far.
This is also the bottom of the Channel Up and a crossing over the 1day MA50 (white line) will be the buy trigger.
Additional indicator to look for
Jasmy to rally to between $0.35-$0.50 at the peak of bull cycleJasmy token has been caught between 2 pivot zones. The price is currently in the support zone between $0.008 and $0.012 . This zone must be defended on a weekly closing basis.
To the upside is resistance between $0.048 and $0.07. Breaking above this resistance, on a weekly closing basis, will like
Jasmy Double Bottom Potential Reversal?Let’s break this down based on the scenario you’ve described and explore what it might mean for Jasmy’s price movement, while keeping it grounded in general technical analysis principles.
Historical Context and Double Bottom Analysis
I’ve noted two key periods:
November 2021 to March 2022:
-Jasmy t
See all ideas


