Very good touch here $KAVABullish Pennant here , waiting for break up , and retest , at the retest we can entry for long
Remember to manage your risk !
Dyor!
Goodluck!
KAVAUSDT.P trade ideas

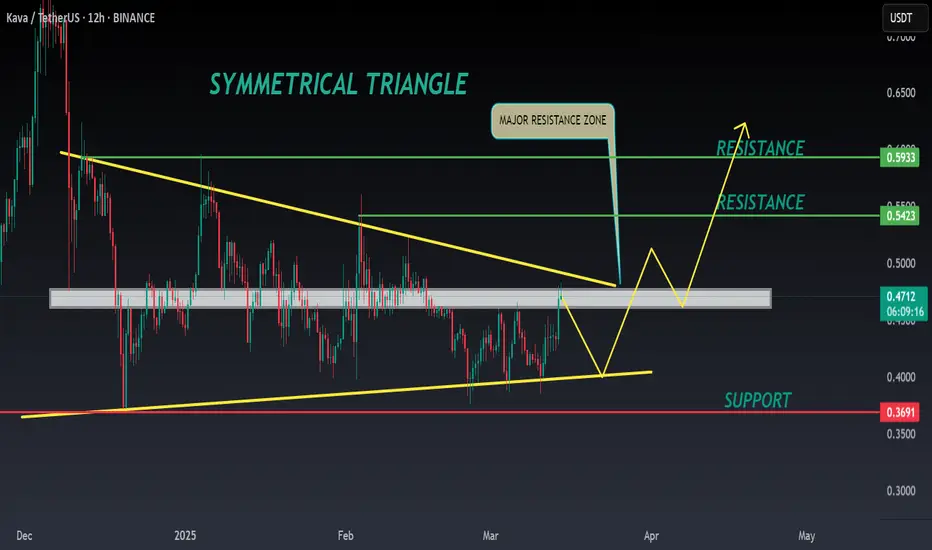
KAVA ANALYSIS🔮 #KAVA Analysis
💲💲 #KAVA is trading in a Symmetrical Triangle Pattern. If the price of #KAVA breaks and sustain the higher price then will see a pump. Also there is an instant strong support zone. We may see a retest towards the support zone first and then a reversal📈
⁉️ What to do?
- We have marked crucial levels in the chart . We can trade according to the chart and make some profits. 🚀
#KAVA #Cryptocurrency #Support #Resistance #DYOR
KAVAUSDT 1WKAVA ~ 1W Analysis
#KAVA This is the lowest support for now. Buy gradually from here with a short -term target of at least 20%+.

Kava (KAVA): Possible Cup&Handle Pattern / Easy 2x We noticed a possible formation of Cup & Handle, which could send the price to make 2X on the daily timeframe!
More in-depth info is in the video—enjoy!
Swallow Team

KAVAUSDT UPDATEKAVAUSDT is a cryptocurrency trading at $0.4711. Its target price is $0.7500, indicating a potential 70%+ gain. The pattern is a Bullish Falling Wedge, a reversal pattern signaling a trend change. This pattern suggests the downward trend may be ending. A breakout from the wedge could lead to a strong upward move. The Bullish Falling Wedge is a positive signal, indicating a potential price surge. Investors are optimistic about KAVAUSDT's future performance. The current price may be a buying opportunity. Reaching the target price would result in significant returns. KAVAUSDT is poised for a potential breakout and substantial gains.

KAVA is bearish (4H)KAVA has been consistently making lower highs and lower lows in the swing structure for some time.
Now, a major base has been broken, and a Flip zone has formed. There are also liquidity pools below the chart, which we have marked.
From the supply zone, it can move toward the targets shown on the chart. The targets are clearly marked on the chart.
A daily candle closing above the invalidation level will invalidate this analysis.
Do not enter the position without capital management and stop setting
Comment if you have any questions
thank you

UniversOfSignals| KAVA: A Dive into DeFi's Cosmos EcosystemIn this analysis, I want to discuss the KAVA coin, a notable DeFi platform in the Cosmos ecosystem, which currently ranks 129th with a market cap of $472 million.
📅 Weekly Timeframe
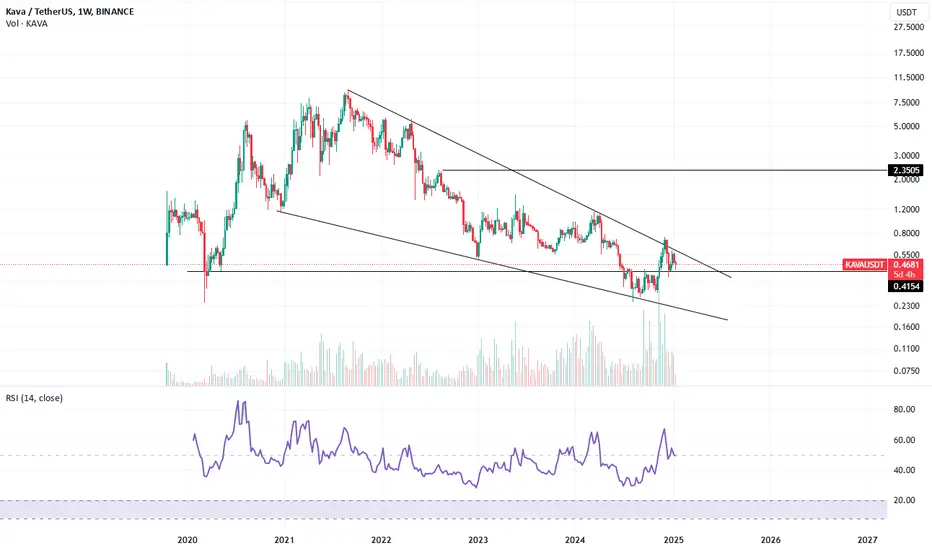
We are witnessing a downward trend in the weekly timeframe, where the price has been moving along a descending trend line, with the most recent bottom recorded at the $0.2872 area.
🔍 Currently, a significant price ceiling has been set at $0.6981, and the price has recently been rejected from the descending trend line, likely moving towards the support floor again.
🔼 The support at $0.2872 is crucial, and if broken, the price could set a new historical bottom. For the trend to turn bullish, confirmation will come after breaking the trend line and surpassing the resistance at $1.1434.
📊 Volume divergence has been observed with the trend for some time now, but this divergence has yet to impact the trend, which continues to persist.
📅 Daily Timeframe
In the daily timeframe, we can observe the price movement in greater detail.
⚡️ As you can see, after reaching $0.7197, a corrective phase began, and currently, at the 0.618 Fibonacci level, a significant support has formed, overlapping with the $0.4118 area, creating a Potential Reversal Zone (PRZ).
✅ If the support at $0.4118 is breached, we might witness the next downward leg of the price, which could extend to the 0.786 Fibonacci level, and in case of increased downward momentum, the next target could be at $0.2925.
🛒 On the other hand, for a long-term long position, you could enter upon breaking the trigger at $0.5577, holding the position towards a target of $0.7179. The main trigger for spot buying is also $0.7179, but it is better to get the spot trigger confirmation from this coin’s Bitcoin pair.
📝 Final Thoughts
This analysis reflects our opinions and is not financial advice.
Share your thoughts in the comments, and don’t forget to share this analysis with your friends! ❤️

TradeCityPro | KAVA: A Dive into DeFi's Cosmos Ecosystem👋 Welcome to TradeCityPro!
In this analysis, I want to discuss the KAVA coin, a notable DeFi platform in the Cosmos ecosystem, which currently ranks 129th with a market cap of $472 million.
📅 Weekly Timeframe
We are witnessing a downward trend in the weekly timeframe, where the price has been moving along a descending trend line, with the most recent bottom recorded at the $0.2872 area.
🔍 Currently, a significant price ceiling has been set at $0.6981, and the price has recently been rejected from the descending trend line, likely moving towards the support floor again.
🔼 The support at $0.2872 is crucial, and if broken, the price could set a new historical bottom. For the trend to turn bullish, confirmation will come after breaking the trend line and surpassing the resistance at $1.1434.
📊 Volume divergence has been observed with the trend for some time now, but this divergence has yet to impact the trend, which continues to persist.
📅 Daily Timeframe
In the daily timeframe, we can observe the price movement in greater detail.
⚡️ As you can see, after reaching $0.7197, a corrective phase began, and currently, at the 0.618 Fibonacci level, a significant support has formed, overlapping with the $0.4118 area, creating a Potential Reversal Zone (PRZ).
✅ If the support at $0.4118 is breached, we might witness the next downward leg of the price, which could extend to the 0.786 Fibonacci level, and in case of increased downward momentum, the next target could be at $0.2925.
🛒 On the other hand, for a long-term long position, you could enter upon breaking the trigger at $0.5577, holding the position towards a target of $0.7179. The main trigger for spot buying is also $0.7179, but it is better to get the spot trigger confirmation from this coin’s Bitcoin pair.
📝 Final Thoughts
This analysis reflects our opinions and is not financial advice.
Share your thoughts in the comments, and don’t forget to share this analysis with your friends! ❤️

Long KAVAUSDT (D1). X2Long KAVAUSDT on D1
Entry : current price (0.49-0.5)
TP : 1 (x2)
Exit : confirmation on D1 below PoC & MA200 (0.4).
RR = 5:1
Duration: from 2 weeks to 1.5-2 moths probably.
Why?
After the great capitulation we witnessed yesterday (more than 2bln liquidations of 700k traders) KAVA shows unprecedented signs of strength.
Bounced on big volume from PoC and MA200 (which are also above multi-month consolidation in july-nov 2024).
Haven't done a thorough research on project's fundamentals. So, in case you DYOR'ed it please leave a comment if there's red flags from this perspective.
But regarding TA, that's exactly that I wanted to see.

KAVA/USDT 300% Growth PotentialKAVA is one of the few coins that held exceptionally well during the recent market manipulation. While most cryptos printed new lower lows, KAVA/USDT formed a solid double bottom around the psychological support at $0.40.
From a technical perspective, this setup suggests strong upside potential. If the support holds, we could see a significant bullish breakout in the coming months. I wouldn't be surprised if the price skyrockets by 300% over the next three months.
Are you bullish on KAVA?

KAVA ANALYSIS📊 #KAVA Analysis
✅There is a formation of Descending triangle pattern on 1 day chart with a breakout 🧐
Pattern signals potential bullish movement incoming after a consolidation
👀Current Price: $0.5050
🚀 Target Price: $0.5600
⚡️What to do ?
👀Keep an eye on #KAVA price action and volume. We can trade according to the chart and make some profits⚡️⚡️
#KAVA #Cryptocurrency #TechnicalAnalysis #DYOR

KAVA/USDT Trading ScenarioThe asset's price, like most altcoins, has undergone a significant correction and is currently trading near its local low. However, despite the decline in quotations, the market is experiencing a noticeable increase in trading volumes, indicating strong demand from buyers. A confident absorption of supply during the downturn suggests potential interest in KAVA from large players.
From a volume analysis perspective, the price is within the Point of Control range, reflecting the highest trading volume in the current price corridor. This confirms substantial market participant interest and the formation of a liquidity zone, which may act as support if consolidation continues. If volumes continue to rise and the price holds above key levels, this could signal a trend reversal and the development of an upward momentum.

Run baby run.... KAVA is showing us a symmetrical triangle pattern, that indicates a possible consolidation, and from here we can move in a violent way... Let's see...
This is not a financial advice, please invest at your own risk

KAVA update#KAVA made another triangle with 5 waves as wave B in ABC pattern now we are waiting for the C wave so now we can expect another down in the market

Will #KAVA Reverse or Continue its Downward Move? Key LevelsYello Paradisers! Is #KAVAUSDT on the verge of a decisive breakout, or are we about to witness a major rejection that could spell trouble for bulls? Let’s break down the #Kava setup:
💎#KAVA is at a critical juncture. The price is currently hovering around $0.498, stuck beneath a descending resistance that has been capping bullish momentum. For a convincing breakout to materialize, #KAVAUSD must close decisively above the resistance zone at $0.58-$0.60. If this happens, the next targets are set at $0.750, and potentially, the major resistance zone will be near $0.85.
💎The supply zone between $0.58-$0.60 remains a hurdle. Failure to clear this resistance could trigger a rejection, leading to a pullback towards the strong support zone at $0.437-$0.372. This level has proven reliable in the past, offering a base for bulls to reload.
💎If the price closes below $0.372, the bullish setup will be invalidated. In this scenario, #KAVA could test lower support levels, potentially heading toward $0.30 or even lower. A breakdown here would confirm that sellers are in control, leaving bulls sidelined for now.
💎You need to watch for a breakout above the resistance at $0.58-$0.60, supported by strong volume. Without it, any breakout attempt could be a fakeout. Similarly, if a rejection happens, keep an eye on the demand zones—volume will confirm whether buyers are stepping in or if sellers are driving the trend further down.
Stay focused, patient, and disciplined, Paradisers🥂
MyCryptoParadise
iFeel the success🌴

#KAVA/USDT#KAVA
The price is moving in a descending channel on the 1-hour frame and is expected to continue upwards
We have a trend to stabilize above the moving average 100 again
We have a descending trend on the RSI indicator that supports the rise by breaking it upwards
We have a support area at the lower limit of the channel at a price of 0.5360
Entry price 0.5460
First target 0.5636
Second target 0.5832
Third target 0.6067

KAVA ANALYSIS🚀#KAVA Analysis :
🔮As we can see in the chart of #KAVA that there is a formation of "Falling Wedge Pattern". In a 3d timeframe #KAVA broke out the pattern and perfectly retest the levels. Expecting a bullish move in few days
⚡️What to do ?
👀Keep an eye on #KAVA price action. We can trade according to the chart and make some profits⚡️⚡️
#KAVA #Cryptocurrency #TechnicalAnalysis #DYOR

KAVAUSDT 1W#KAVA has formed a falling wedge pattern on the weekly chart. In case of a breakout, a massive bullish rally is expected. Buy a bag and hold.
Targets are:
🎯 $1.0480
🎯 $1.5221
🎯 $2.3119
🎯 $2.9503
🎯 $3.5886
🎯 $4.4974

KAVAUSDT 1WKAVA Update ~ 1W
#KAVA So far it still maintains its bullish structure. If you still have Conviction on this coin,. Buy here, Target 20%++

KAVAUSDT: Short-Term Bounce or Long-Term Opportunity?KAVAUSDT: Short-Term Bounce or Long-Term Opportunity? 🚀
Traders, let’s talk about KAVAUSDT, a coin making waves in the market right now! With a whopping %477 daily volume spike and significant CDV data pointing to heavy buyer activity, this is one setup you don’t want to ignore.
Here’s the breakdown:
Short-Term Blue Box: Found using precise CDV data, this zone is perfect for a quick bounce trade. Timing and precision will be key!
Long-Term Blue Box: This level acts as a safety net during a potential market crash. But let me be clear: I’m not waiting for it. With current data showing strong accumulation, the first zone looks very promising.
Why this matters: CDV analysis reveals a surge in buy activity, signaling that smart money is stepping in. Combine that with the volume explosion, and we’ve got a high-conviction play here.
Risk Management Tip: Be cautious but confident. Set clear stops, and don’t let greed cloud your judgment.
Your next move? Analyze the zones, plan your entries, and let the data guide you. What’s your take on KAVA? Boost, comment, and follow to stay ahead in the market!
Let me tell you, folks, this is amazing. Nobody does analysis like I do. Believe me. If this helps you, don't forget to boost and comment! It’s a big deal, motivates me to share even more winning insights with you. Tremendous insights.
Let me tell you, this is something special. These insights, these setups—they’re not just good; they’re game-changers. I've spent years refining my approach, and the results speak for themselves. People are always asking, "How do you spot these opportunities?" It’s simple: experience, clarity, and a focus on high-probability moves.
Want to know how I use heatmaps, cumulative volume delta, and volume footprint techniques to find demand zones with precision? I’m happy to share—just send me a message. No cost, no catch. I believe in helping people make smarter decisions.
Here’s the list, long list, great list, of some of my previous incredible analyses. Each one, a winner:
🎯 ZENUSDT.P: Patience & Profitability | %230 Reaction from the Sniper Entry
🐶 DOGEUSDT.P: Next Move
🎨 RENDERUSDT.P: Opportunity of the Month
💎 ETHUSDT.P: Where to Retrace
🟢 BNBUSDT.P: Potential Surge
📊 BTC Dominance: Reaction Zone
🌊 WAVESUSDT.P: Demand Zone Potential
🟣 UNIUSDT.P: Long-Term Trade
🔵 XRPUSDT.P: Entry Zones
🔗 LINKUSDT.P: Follow The River
📈 BTCUSDT.P: Two Key Demand Zones
🟩 POLUSDT: Bullish Momentum
🌟 PENDLEUSDT.P: Where Opportunity Meets Precision
🔥 BTCUSDT.P: Liquidation of Highly Leveraged Longs
🌊 SOLUSDT.P: SOL's Dip - Your Opportunity
🐸 1000PEPEUSDT.P: Prime Bounce Zone Unlocked
🚀 ETHUSDT.P: Set to Explode - Don't Miss This Game Changer
🤖 IQUSDT: Smart Plan
⚡️ PONDUSDT: A Trade Not Taken Is Better Than a Losing One
💼 STMXUSDT: 2 Buying Areas
🐢 TURBOUSDT: Buy Zones and Buyer Presence
🌍 ICPUSDT.P: Massive Upside Potential | Check the Trade Update For Seeing Results
🟠 IDEXUSDT: Spot Buy Area | %26 Profit if You Trade with MSB
📌 USUALUSDT: Buyers Are Active + %70 Profit in Total
🌟 FORTHUSDT: Sniper Entry +%26 Reaction
🐳 QKCUSDT: Sniper Entry +%57 Reaction
📊 BTC.D: Retest of Key Area Highly Likely
This list? It’s just a small piece of what I’ve been working on. There’s so much more. Go check my profile, see the results for yourself. My goal is simple: provide value and help you win. If you’ve got questions, I’ve got answers. Let’s get to work!

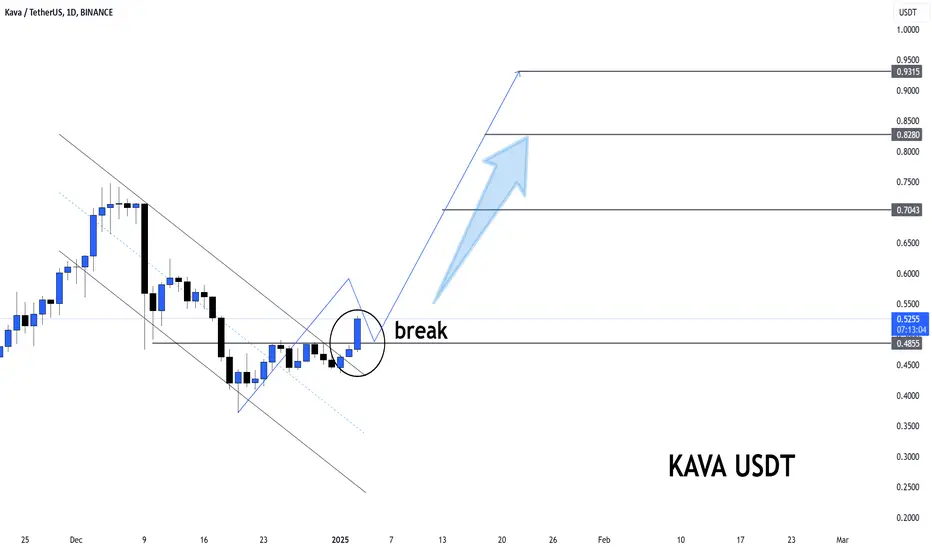
KAVA/USDT Analysis
#KAVA has successfully broken out of a descending channel, indicating a bullish reversal
Retest Confirmation: The breakout level around $0.50 is being retested, acting as a strong support zone.
Projected Targets 📈
🎯 Target 1: $0.7043
🎯 Target 2: $0.8280
🎯 Target 3: $0.9315
Prepare to BUY Spot KAVA (W-M Cycle)Prepare to BUY Spot KAVA (W-M Cycle)
🌟 Mid-Term Opportunity with KAVA! 🌟
🌍 Market Overview:
KAVA is showing strong bullish signals on the Weekly (W) and Monthly (M) timeframes, making it an excellent candidate for mid-term growth.
📊 Trade Plan:
📌 Entry Point: $0.49 - $0.52 – Accumulate in this range for an optimal position.
🎯 Target: $1.2 - 2.6$ – Aiming for significant mid-term returns.
⏳ Hold Time: 3-5 weeks – Strategically aligned with the W-M cycle.
🔍 Strategy Insights:
W-M Momentum Strategy:
Designed to capitalize on larger trends for steady and sustainable profits.
Indicator Confirmation:
Use tools like RainBow MG3 to validate BUY signals and optimize entry.
💡 Note: This is not financial advice. Always DYOR before trading.
🔥 KAVA is ready for a powerful move – Secure your position now! 🔥
