KNC/USD - Moon mission to $5 / ATHKNC is looking excellent here, after breaking the $1 level and holding it well, we are now well on our way to test new highs.
MACD on weekly shows very good momentum building up for new highs, I expect KNC to continue up for the next few months.
In terms of targets there are several and these depend on your tolerance and trading plan. Below a summary:
TP 1: $1.8 - This is a good conservative target, very likely to be hit without much concern.
TP 2: $2.7 - This is in line with the previous top, therefore if we pass $2 this is the next best target
TP 3: $5 / ATH - If the bull market continues well into early summer 2021, then KNC has all chances to reach it's old ATH of $5
Beyond that is anyone's guess, however, a target of $5 seems a bit difficult at this time to predict, so the first two look more realistic to me. We can update later.
Like and follow if you liked this idea!
KNCPERP trade ideas

KNC TA - weekly chart Rules:
- Retracement should be about one-third of two-thirds of the previous move
- Same rule is applied to the time 1/3 – 2/3
____________________________________________________________________________________________________________________
1 to 2 – Upward movement taken about 1 week
2 to 3 – Downward movement, approximately 3 weeks, bearish trend, not the previous rising movement last 1/3 of this one.
3 to 4 – Upward movement, approximately 6 weeks, it is a crucial point due to longer period to build up in comparison to previous movement, probable trend reversal. Buying zone with a stop limit positioned at lowest value of point 3.
4 to 5 – Retracement from previous bullish trend, approximately 2 weeks, in accordance to the rule, 2 weeks of 6 weeks = 2/3 of time retraction.
5 to 6 – continuous of bullish trend. About 5 weeks.
6 to 7 – Correction, about 2 weeks. 2/5 = 0.4 = between 1/3 and 2/3, rule is respected.
7 to 8 – short bullish trend of two weeks, at this point trader must start pain attention for a possible reversal.
8 to 9 – 4 weeks bearish trend, period longer than previous one breaking a sequence of short periods of corrections. However trough left still is higher than previous one, zone must be taken into consideration for a possible selling zone.
9 to 10 – 3 weeks of a bullish trend leaving the same peak as previous one, reversal signal, it can be sold here to make profit or wait until the confirmation of reversal trend.
10 – 11 – long bearish trend of 7 weeks, crossing the last through left in point 9, indicating the confirmation of a reversion, selling zone can be previously stablished putting a stop limit on point 9 and profit is masking between 10 and 11.
11 to 12 – Correction of 2 weeks from previous movement.
12 to 13 – 4 weeks of bearish trend continuation leaving an important through at point 13.
13 to 14 – Crucial point: Bearish trend of 4 weeks, longer than previous bullish trend, breaking 1/3 to 2/3 rule of retraction in time. In addition ascending peak compared to the previous one.
14 to 15 – Buying zone: 5 weeks of bearish trend breaking the rule of correction again and leaving a through higher than previous one, possible buying is to be executed in point 15, putting a stop limit in point 13.


KNC forming an ascending triangleif the ascending triangle continues then we will see KNC move to 1.58.

KNCUSDMID-TERM: 4hr and daily classic bullish divergence at a support. Will fail if bitcoin falls heavily. Not financial advice.

KNCUSD - Short Term $2, Mid Term - $5, Long Term - $10KNCUSD had a beautiful close above the 200MA. I expect bullish continuation and want to see $1.18 level hold. Below that .97 and 1.03 are the supports. Ideally, if there is a drop, these are great buy zones for long term accumulation.
Typically, when you want to invest you take a 25% position and ladder your buys down to the next support levels, so you can Dollar cost average in your entry. We are in a beginning of a new Bull Cycle for ALTs, so plan accordingly. The price action and timeline may not exact play out level by level, it just idea on how I think it will and it may change based on market conditions.
Note: This is not a Financial Advise. Just my thoughts! Crypto is a risky market, so don't invest that you're not willing to lose.

KNC looking bullishLooking forward to breaking first resistance/yellow then chasing my target as shown on chart. Good luck if u also taking positions too!!!

KNCThe Content is for informational and entertainment purposes only, you should not construe any such information or other material as legal, tax, investment, financial, or other advice. This is not financial advice nor am I a financial adviser. :)

KNC/USD - At support, $3 in play for wave 5KNC is currently at a significant support line. There are reasons to think it will hold and push us higher. For that to happen, we need to break the diagonal resistance which so far was a hard one to crack.
KNC is getting squeezed in this blue apex between support and resistance. Expect price to react in the next few days, then aim to long or short it, as applicable.
A short should aim to find support at the top of wave 1 and a long should target $3.
Like and subscribe!

KNCUSD strategy inside the abyssKNCUSD is suffering, and honestly shows no clear signs that it will recover against the rest of the market at the present moment. I listed a few key support and resistance areas on the chart.
To the downside, $0.50 support is extremely strong. In the current market conditions, it's hard to suggest keeping capital on the side and waiting for this area, but maybe just a zone to keep in mind in case the situation gets even worse and you are looking to rebalance from other coins that have pumped up. It's definitely possible, and I daresay probable that the local bottom is already in, but the setup looks surprisingly similar to XTZ which recently made a new lower low. It's not hard to imagine other weak alts breaking further down to also make lower lows.
To the upside, we are pushing up against key downtrend resistance at the moment. If this breaks, the low $0.9 range is on the table and worth taking some profits if you entered now at $0.8. Beyond that point, there is another huge downtrend resistance to fight through. If somehow KNC musters the strength to break through the second downtrend resistance, then targets around $1.5 are on the table. At this point, I would strongly advise taking the majority of profit in this $1.5 to $1.6 range and seeing what the market reaction is. If the reaction is violent downside as was the case in November, then we'll need to reassess the situation when the new data is available. If it shows strength and converts prior resistance back into support, then it's possibly worth getting back in and hoping for a breakout above $2.0 with upside targets above $3.0, but it's not a sure thing.
It is almost never advisable to invest in an asset that shows extreme weakness in a bull market and has not yet displayed any signs-of-strength, but in case you're already holding heavy bags, hopefully this analysis helps a bit. Let's see what happens.

$KNC squeezed swingPrice right below Pivot/ Horizontal Resistance inside a giant falling channel. Looking for the breakout here in a few days for swing trade.

KNC by next yearI believe there will be a buying opportunity for KNC in the first week of January. That if it will not break the upside. However, base in history there will be a slight correction in the first quarter.

KNC doing thingsFib extention targets
Hidden bullish divergence (forget to draw its line) manifested into Regular bullish div and RSI ready for a breakout
Entry: 0.81
Exit 1, 2, 3 according to fibs
STOP LOSS : 0.69 usd
Daily timescale ! needs time to play out , don't forget your stop loss

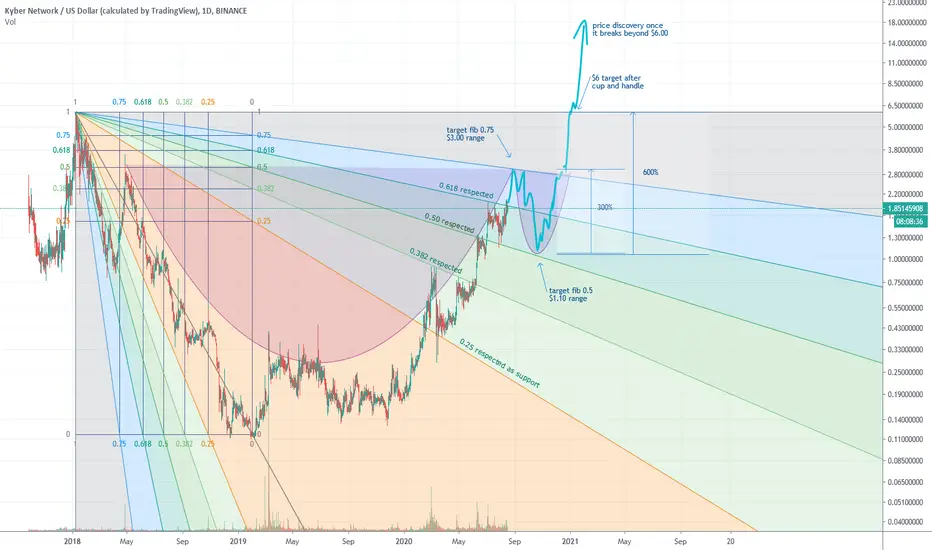
Just an idea of what may be on its wayGoing strictly by the fib fan and the mirrored pattern we are seeing here with the interior cup and handle spanning over 1000 days which would bring KNC to its all time high and from there possibly into price discovery if it can surpass that level. Consolidation periods for these moves may be more or less exaggerated then shown but you get the idea.
KNC Targets - LongKNC is approaching the first support zone of $0.86 which would be a good place to open a long.
We could see a potential move towards $1.05, $1.20 and $1.31. Failure to hold the support at $0.86 could result in a drop in price towards $0.79 and $0.70.


Kyber Network Areas to Buy. KNC. Areas to buy KNC, broke trendline. Good areas to buy. COINBASE:KNCUSD

KNC short and then longupdate on the 4hr TF
- looking like a descending triangle with a target around 0.75
- it is going to drop with the rest of alts
- if it holds 0.75, then upward momentum follows
im here to learn, let me know your thoughts!

KNC possible breakouts- breakout coming soon
- scenario UP - breakouts higher and closes the right shoulder of a bullish inverted H&S pattern
- scenario DOWN - breakouts lower according to descending triangle pattern and drops to around 0.67 - 0.70 area
im here to learn, so im open for any comments you might have. thank you.

KNCUSDT D1: BEST Level to BUY/HOLD 85% gains(SL/TP)(NEW)Why get subbed to me on Tradingview?
-TOP author on TradingView
-15+ years experience in markets
-Professional chart break downs
-Supply/Demand Zones
-TD9 counts / combo review
-Key S/R levels
-No junk on my charts
-Frequent updates
-Covering FX/crypto/US stocks
-24/7 uptime so constant updates
KNCUSDT D1: BEST Level to BUY/HOLD 85% gains(SL/TP)(NEW)
IMPORTANT NOTE: speculative setup. do your own
due dill. use STOP LOSS. don't overleverage.
🔸 Summary and potential trade setup
::: KNCUSDT daily chart review
::: chart looks good /strong
::: speculative XABCD setup
::: limited downside from here
::: BULLS seek to BUY/HOLD from point C
::: 0.85 support mirror S/R level
::: expecting short-term pullback
::: BULLS wait for re-test of 0.85
::: and BUY/HOLD after pullback
::: BULLS get ready to BUY after pullback
::: TP bulls is +85% gains later
::: exit near point D +85% gains
::: expecting re-test of heavy resistance
::: details: see chart
::: FINAL TP is 1.35//1.45
::: recommended strategy: BUY/HOLD after pullback
::: TP BULLS +60% gains
::: SWING TRADE: BUY/HOLD IT
::: bull run not over yet
::: good luck traders!
::: SHORT and get paid. period.
🔸 Supply/Demand Zones
::: N/A
::: N/A
🔸 Other noteworthy technicals/fundies
::: TD9 /Combo update: N/A
::: Sentiment mid-term: BULLS
::: Sentiment short-term: BEARS/PULLBACK

KNC/USD: Two Short-Term Bullish PatternsAscending triangle or cup & handle formation....breakout is likely and immediate target would be. $1.30. Welcome any thoughts.

KyberNetwork bullish trend continues [LONG KNC]It seems like KNC will continue to enjoy the bullish DeFi trend for the next few weeks.

