Potential short term bullish tradePotential short term bullish trade from lower 3000's to higher 3000's.
LBCBTC trade ideas

Safest buy range$LBC is one of those coins that has been slow lately and didn't pump too hard during December crypto run-up. This won't happen again, hop on board and get ready for the show.

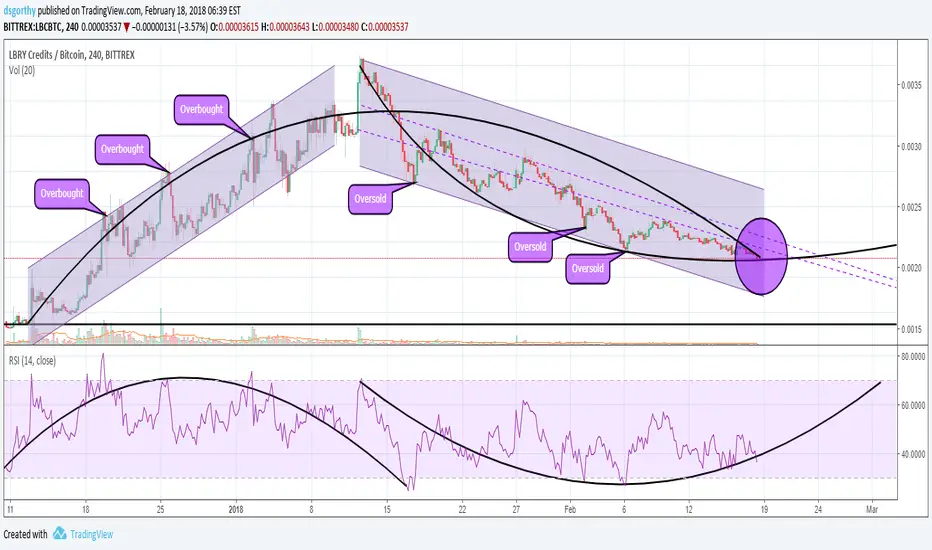
LBRY Credits (LBRY) Analysis and Trend Identification.I heard about BITTREX:LBCBTC back in early January and bought in right around the peak in January. I was riding the upward channel for a couple of days but failed to stick to my guns and decided to hold. Since then, I've seen a 50% retrace and am seeing a slowing of the downward trend. See my other analysis in the related link below on BINANCE:RLCBTC where we see similar signs and a near perfect bounce off of the parabolic upward-facing line. I'm not seeing BITTREX:LBCBTC level out quite as much, but the charts are surprisingly similar. We will likely continue in the downward channel for a bit longer. A move towards the upward edge of the channel will be a sign of a potential reversal.
See the several spikes on the upward channel that I saw as a strong sign a month ago -- the RSI showed overbought and right after we saw a retrace. We've seen three oversold markers on this descent, and it seems like there will be a fourth touch coming up soon. The difference is, we're leveling out approaching the next touch. I'm looking for a touch within the purple circle and a retrace following the right side of the parabolic line. Significant volume on a reversal should signal the end of this downtrend and put us into another bullish trend, as COINBASE:BTCUSD leads the recovery of the entire market.
If we see the price continue to drop with no dip below the RSI bound, this will confirm another continuation of the downward trend. I'd like to hear your thoughts on BITTREX:LBCBTC ! Please comment below, as the more input we see, the more informed we are!
*** This is not a recommendation to buy or sell, this is for educational purposes only! ***
LBRY in a head and shoulders formation? Will it plummet?Looks like a head and shoulders pattern for LBRY. As you can see there was a strong 600% impulsive wave up. W2 corrective may drop to about 1780 satoshi's. OR maybe the strong impulsive wave up will counteract the effects of a decline from the Head and Shoulders . But if affects of H&S kicks in, we could see a significant drop in value.
**** This is not investment advice. I am not a financial adviser. Invest at your own risk.


LBC ANALYSIS FEBRUARY 16 , 2018We talk a bit about technical analysis and indicators
The RSI is the best buying area between the 30 and 20 pips line, and the best spot to sell between 70 and 90 points
Bollinger Bands represent mobile support and resistance lines
We now see the price below the midline of the Bollinger Bands index and the best buy is after the high price to move up below the midline
Now the prices are likely to continue downwards to hit 0.000000000 BTC and then start the ascending journey
Or the prices will rise from current prices between 0.00004000 BTC and 0.00003500 BTC
Fibonacci retracement lines give us serious indicators for support and resistance lines
It's free for you when the deal comes in, and it's best to wait until prices move above the mid-line of Bollinger Bands

$LBC 500% possible in March$LBC chart requires no explaination.
Traditional Wall street cheat sheet can tell a lot about $LBC chart.
Catalyst : Mobile App,Social sharing, Paper wallets and USD gateway coming.

$LBC / $BTC Update, Sitting on supportAn update to my last post on LBC.
Looks like a massive bullflag is formed. That and a strong support has been verified. And Bullish Divergence is present.
DYOR, this is for eduaction. GL out there.

LBC double bottomprice double bottom but rsi lower low, bullish divergence
then go up, your time is coming

Library Credits How to Trade and Make 10% to 60% Profit LBCBTC is at the Green Trend Line as you can see and has been Following Fib levels as you can see there is resistance and support at every fib levels you can wait for the Green Trend Line to break to buy in which should happen soon first target is Fib Level 0.382 @ 4500 sats where it failed to Break as you can see in the Chart Second Target is at 0.5 Fib Level @ 5400 which acted as support Previously and you can get the remaining Targets from the Fib Level At 0.618 it is 6400
Buy After Green Trend Line Breaks
TP 1 4500
TP 2 5400
TP 3 6400
Do Follow my Telegram Channel for Trading Tips and Ideas as well as Helping you Trade

LBC/BTCBUY 0.000041 - 0.000038
TARGET 1 0.000045
TARGET 2 0.000048
TARGET 3 0.000053
TARGET 4 0.000057
STOP 0.000036

$LBC Not yetI think were still heading down before we start the next cycle up. Yellow and red are marked support levels where i think the channel will reverse to the upside.
- Yellow being the more ideal area but we could touch the red for a double bottom.
- MACD, RSI and Volume are all turning down, which is why i feel we still have some room to descend.
- i think we will start seeing real upward progression around the march time frame when Bitcoin starts to get really bullish again. Most Alts in my opinion are waiting for Bitcoin to make the first move

LBC is super ready to moonshotThere is a little bit of everything here from what I see.
I'm in love with this chart because its literally a market cycle chart to a exact T.
Volume is up, it may be down a little from the peak euphoria of the BTC run, but its still 5x the volume of the last pump.
So far the fractals are strikingly similar.
Bullish Div predated the last spike. Off of the second touch of the bullish div is where is makes the run, and thats where the price sits right now.
At the bottom of the BB right now as well.
You can confirm the bullrun with a RSI move above 50, and likely that entry would still be a great buy in. But this is currently my heaviest bag.
This is for education. And for Bob Ross birdies, thats all.


LBC (and many other alts) ready for continued markupMany charts currently look the same, and it appears another round of alt pumps are on the horizon.


$LBC / $BTC Chart, seems to be repeating itself, +500% plus?Tons of similarities about this current fractal LBC is forming right now.
Both formed very shortly after exiting the 1D cloud
RSI beginning prior fractal =67, RSI beginning current=71
Ending RSI of prior fratal before pump =41.97, Current fractal RSI =42.92
As long as we don't break down below the support line and retest the cloud this one should be good for a +500% over the next few months.
This is not advise, this is for education, you should DYOR.

LBC (Waiting for Fractal Breakout)- 25 days of 45% Pullback after 40 days of 400% from bottom
- Falling Wedge Fractal
- Consolidation Volume
- Price action ranging between EMA 50 and EMA 200
- Kijun Bounce (Not in chart)
- RSI Over selled
Trend is your friend, trend still fine, just a little shakeout before follow the travel.

LBRY credits - idea - LBRY has some unbelievably high targets, with lots of volume coming in. Get in while you can.

So much drama in the $LBC1D cloud broke, then retraced to EMA
Hidden divergence
Bullish kumo twist
Close to golden cross

LBCBTC - LBRY Credits with great potential FA
LBRY is a decentralized, open-source protocol that is controlled by its users. LBRY facilitates a similar experience to services like YouTube, Netflix, and Apple TV... but LBRY is entirely decentralized!
TA
We have good amount of data with LBC to do some analysis. LBC has gone through a major correction since June-July and has bottomed out at December. It has started to pick up and is showing bullish divergences (one of the main things I look at) and looks set to test the resistance at 10k sats. Stoch RSI is pointing up as well so 1d candle looks good!
This should follow similar behaviour as STRAT so expecting to moon sometime in the next few months.
This is a strong long-term trade.

LBC Library Credits possible breakout alertstill learning here guys
But looks like a breakout, RSI, ema, candlestick, and Elliot wave confirmed as early as possible. prob a good entry right now

lbc last call for last accuget your bag this potential high
later on u can damn yourself missing this one
