LINA: Tracking New DevelopmentsGreetings Traders,
Our spotlight today returns to LINA, a key participant in the crypto sphere. At present, LINA's market price is 0.018002.
Significant Technical Observations
Upon examining the updated data for LINA, several significant insights emerge:
Relative Strength Index (RSI) and Stochastic: With an RSI of 81 and stochastic of 69, LINA is demonstrating strong bullish momentum. However, the high RSI could indicate overbought conditions, suggesting potential price correction.
Bollinger Bands: Currently, LINA's price is near the upper Bollinger Band at 0.018982, with the middle and lower bands at 0.013668 and 0.008354, respectively. This indicates strong upward price movement but also a potential overbought situation.
Volume Oscillator: The volume oscillator sits at 6%, indicating a slightly bullish volume.
MACD: The MACD value of 0.001837 signals potential bullish momentum, aligning with other positive indicators.
Fibonacci Levels: The Fibonacci levels for the 4-hour timeframe have evolved to 0.01119, 0.012904, 0.014528, 0.016152, and 0.017155. These levels should be watched closely as potential support or resistance.
EMA 100: The 100-period Exponential Moving Average (EMA) currently stands at 0.011674, serving as potential support.
Resistance Levels: Two notable resistance levels are found around 0.018599 and 0.024154. These should be monitored closely for price reactions.
Closing Remarks
Given these updated indicators, traders should maintain a vigilant watch over LINA for emerging trading opportunities. The interplay between price movements and these technical indicators may offer insights into future market trends.
Remember, trading carries inherent risk. Do your own research and consider your risk tolerance before engaging in any trading decisions.
Stay tuned for further updates on LINA and other digital currencies. Here's to successful trading!
LINAUSDT trade ideas

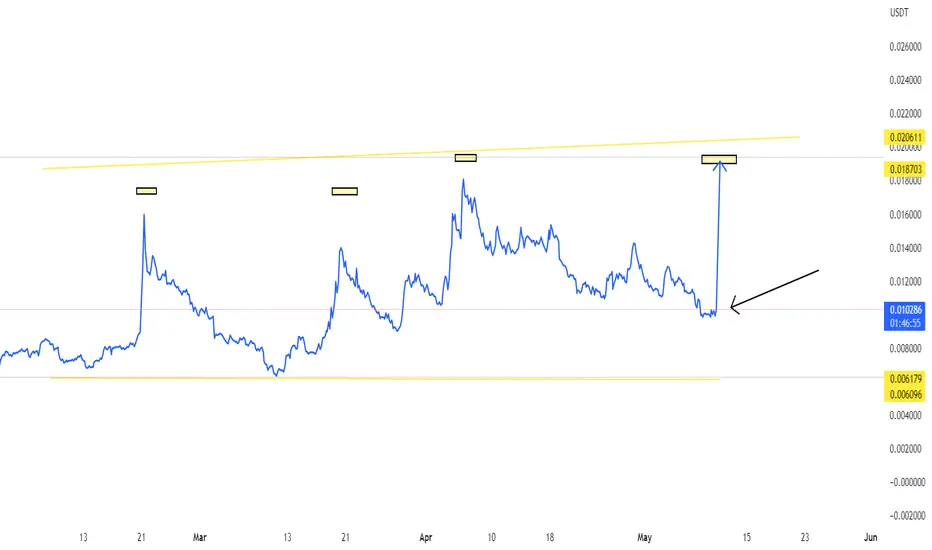

Lina finally breaks Crucial Trendline Seems Like Already bottomed Out Descending trendline breakout Has Already with Strong Momentum + Good Volume Expecting Massive Bullish Wave In Midterm Expecting 300 to 320% bullish Wave

Expecting 45 to 50% bullish wave In Lina Seems Like Ready For Massive Bullish impulse Descending Channel breakout Has already Confirmed Retesting In Process Incase Of successful Retest expecting 45 to 50% bullish Wave

Lina will pump moreLina is reaching 0.016 to complete Ascending triangle. After this triangle breakout, Target will be longs 0.030 - 0.040
Below the red trendline, is Danger for spot and future longs.

LINA: A Comprehensive Technical Analysis and OpportunitiesGreetings Traders,
In this analysis, we’ll scrutinize LINA, a promising player in the world of digital currencies. As of the moment, LINA’s market price sits at 0.013923.
Navigating the Technical Landscape
An array of indicators reveal themselves upon a detailed look at LINA. Here is an outline of the crucial technical insights:
1. Relative Strength Index (RSI) and Stochastic: LINA’s RSI is currently high at 77, hinting at possible overbought conditions. Complementing this, the stochastic oscillator reads at 93, corroborating the overbought scenario. While this signals a strong bullish sentiment, it could also indicate a possible price correction looming on the horizon.
2. Bollinger Bands: The price of LINA is inching towards the upper Bollinger Band at 0.013815. The middle and lower bands are located at 0.01149 and 0.009159, respectively. Prices nearing the upper band often suggest overvaluation and a potential retracement.
3. Volume Oscillator: The volume oscillator is at 6%, showing that the upward volume slightly exceeds the downward volume. This is often viewed as a bullish sign.
4. MACD: The Moving Average Convergence Divergence (MACD) value is at 0.000731. This could indicate a bullish trend. However, the high RSI and stochastic values warrant caution for potential reversals.
5. Fibonacci Levels: The Fibonacci levels on the 4-hour chart stand at 0.010276 for the 0 levels, 0.011088 for the 0.5 level, and 0.011900 for the 1 level. These are significant points to monitor as potential price supports or resistances.
6. Solid Resistance: There appears to be a solid resistance level at 0.014528. This is a critical threshold to observe for any breakout attempts.
Closing Thoughts
Given these indicators, it’s of the utmost importance to keep a close watch on LINA for potential trading opportunities. The intricate relationship between price movements and these technical indicators could reveal key insights into prospective market trends.
Please remember trading involves inherent risk. Independent research and consideration of your risk tolerance are crucial before making any trading decisions.
Stay tuned for further updates on LINA and other digital assets. Wishing you profitable trading!

LINA/USDT - NEXT MOVE - 18% PROFITI think LINA is a good coin to buy,just hold it,Good luck to you all.

LINA back into prev month rangePA bullish back into prev month range from bottom. a hurdle ahead in a potential supply zone. if it overcomes it, expecting this to hit mid range

LINAUSDTKeeping an eye on LINA here, if candle open closes over blue line I will open long position.


LINAUSDTThe structure of this currency has been bearish, so I am waiting for further correction to reach the support level and recheck there.

+10% in Profit in 1 day; Bearish cycle is over nowThe 1000x indicator worked extremely well with 1-hour candles, resulting in a 10% profit (from short selling) in just one day. The bearish cycle is now over, so prepare to go LONG.

LINA 1H Triangle pattern actually worksThat was a good setup to trade LINA for easy 5%. Moreover waiting for a retest to join the ride again, but also depends on btc movement. All the levels you can see on the chart. Triangle patterns with decreasing volatility are the best patterns inside crypto trading.


LINAUSDT SELL PROJECTIONI see Lina/usdt fall down to that support zone . Entered for a sell from above aiming for a rrr of 1:3

Lina Looks promising here Linausdt
Breaking out local horizontal resistance next big resistance is trendline resistance I am expecting breakout soon incase of successful expecting 50-70% bullish move
Dyor | Risk under your control

Lina Forming Another bullish Pattern Seems Like Preparing For Another Bullish Wave Forming Bullish Pennant In H6 timeframe Incase Of breakout Expecting Another 70 to 75% bullish Wave

BINANCE:LINA/USDT Perpetual going towards 4H Bullish Order BlockIf the LINA/USDT pair is going towards a 4-hour Bullish Order Block, it may indicate that buyers are present at that price level and could push the price higher. Whether it will run as Yellow or Orange depends on various factors such as overall market sentiment, trading volume, and other technical indicators.
Traders can use this information to look for potential buying opportunities or adjust their current trading strategies accordingly. However, it's essential to conduct thorough research and analysis before making any investment decisions.

Lina !0.01295 is the price where I set my take profit
It is based on higher tf analysis and it is mini bullish

LINAUSDT wants the supply zone?LINAUSDT has formed a double bottom close to the daily support level at the 0.01$ area. This is a bullish technical pattern that suggests that the market is experiencing a period of consolidation, and buyers are stepping in to support the price at key levels.
Currently, the market is attempting to create a new impulse to retest the supply zone at the 0.015$ area. According to Plancton's Rules, if the price of LINAUSDT manages to break through this supply zone, there is a possibility that the market could continue to trend upwards. This could present an opportunity for new long positions.
–––––
Follow the Shrimp 🦐
Keep in mind.
🟣 Purple structure -> Monthly structure.
🔴 Red structure -> Weekly structure.
🔵 Blue structure -> Daily structure.
🟡 Yellow structure -> 4h structure.
⚫️ Black structure -> <= 1h structure.
Follow the Shrimp 🦐

