There is a clear bullish divergence on 30 mins As we can see there is a clear bullish divergence on 30 mins time frame. As soon as the last Lower High will get broken, we are going to execute our trades.
Entry Point : 7.1036273
Stop Loss : 7.0156733
Take Profit : 7.1910970
Take Profit 2 : 7.2824445
Risk : 2% (Split into two trades)
LINKBULLUSD trade ideas

LINK/USD - Time to Look for Buy SetupsAn interesting pattern has been forming in the LINK/USD chart – the ABC pattern. As we approach the end of wave C, it's important to pay attention to potential buy setups.
As long as we don't break below the $5.90 level, it may be a good opportunity to look for buy setups.
The Investor Satisfaction & Price Divergence indicator also reveals a significant convergence between the normalized satisfaction line and the price normalization.
This convergence may offer deeper insights into market dynamics due to:
Market Sentiment: Close investor satisfaction and asset price can indicate positive sentiment, potentially increasing demand and causing a price rebound.
Alignment of Interests: When satisfaction aligns with the asset price, investors may perceive the price as fair, prompting them to buy or hold the asset, possibly driving up prices.
Market Rebalancing: Approaching the divergence line after substantial divergence might signal market rebalancing. Investors could adjust their positions to close the gap, resulting in a price rebound.
This convergence suggests potential high volatility in the near future. The target is a break above the previous high. I will secure profits along the way.
Stay alert, monitor the chart and indicators, and be prepared to seize opportunities as they arise. Remain vigilant and capitalize on the market's vulnerabilities!

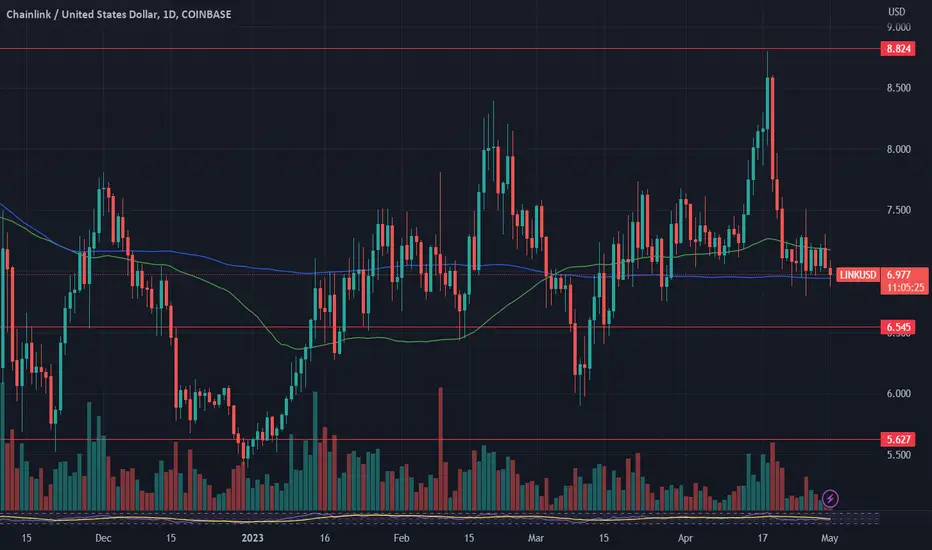
LINK: potential for $7.5After a reversal from the level of $8.7, reached two weeks ago, and a move back to $7.0 support, LINK started a new cycle, all over again. Previous week was a relatively calm one, where the coin was moving in a short range, between levels of $7.0 up to $7.3. Highest and lowest levels during the week were $6.8 and $7.5. Still, during the previous week, investors were more preoccupied with developments over First Republic Bank, so altcoins were out of scope. In this sense, LINK could not perform better than it actually did during the week.
RSI continues to move below the level of 50, indicating that the market is still more oriented toward the oversold side. At the same time, MA50 started to modestly diverge from MA200, but still, it is still unclear whether there is any kind of potential cross in the coming period.
Second week in a row LINK will start by testing the $7.0 support line. There is currently an equal number of buying and selling orders, which implies on potential that $7.0 might hold. At the same time, charts are also pointing that $7.5 short term resistance might be tested in the week ahead.
W9-8 LINK BEARISH IDEA (HARMONIC BEARISH REVERSAL PATTERN)Potential Bearish Entry
Dow Theory In Place - Lower High and Lower Low Expected in Place
Formation of Harmonic Bearish reversal Pattern coupled with bearish divergence at potential reversal zone (PZR)
FIb entry at level 0.382%
SL & TP Levels are defined.

W9.1-26 LINK BULLISH IDEA (DOUBLE BOTTOM)Potential Bullish Entry
Dow Theory In Place - Higher High and Higher Low Expected in Place Formation of DOUBLE bottom coupled with bullish divergence (Bullish reversal pattern) SL & TP Levels are defined.

LINK: starting all over againTwo weeks ago LINK had a very good week, when the price of the coin reached a resistance line at $8.0. Start of the previous week was even better, since the price was pushed to the weekly highest level at $8.7, however, the long term resistance line at $9.0 has not been tested. But the weekend brought some heavy drop in price, due to generally negative market sentiment, erasing totally profits from the last two weeks. The price of LINK is ending the week by testing the $7.0 support line. This was certainly a strong drop, which LINK did not deserve, but the market is always right.
At the beginning of the week RSI reached a clear overbought side, however, the indicator is ending the week below the level of 50, and around 45. Moving averages of 50 and 200 days continue to move as two parallel lines, still not providing much indication whether they are ready for any kind of a cross in the coming period.
LINK will start the week ahead by testing the $7.0 support line. This line was strongly holding during the last period, while emerging buying orders as of the weekend are providing some potential that $7.0 will hold in the coming days. In case of some surprises, the price might go to the level of $6.5 but just within a short period of time. On the opposite side, current charts are showing some potential for $7.5 in the coming days.

LINK/USD Bearish TrendLINK/USD is printing LL and LH, so it's called Bearish Trend according to Dow Theory. Here we instant buy because I don't think so price will go more higher than this price.

Chainlink Long TradeChainlink about to break its triangle it has been forming 51 days , first target will be top of the range at 9.3 dollars.
If you want a more in depth look at chainlink checkout the TA below .
Stop loss and take profit on the TA.
Also checkout this alt coin TA .

LINKUSD Send It!I don't have a clue what this is or what it does, but price keeps poking at resistance and I believe when it's ready the next poke will be violent to the upside. Average entry $8.19.

LINK to $18SL: $ 3
If you want to play this in the short term first exit @
TP1: $ 11
TP2: $ 18
Longer-term spot exit
TP3 : $ 41

LINK to $41SL: $ 3
If you want to play this in the short term first exit @
TP1: $ 11
TP2: $ 18
Longer-term spot exit
TP3 : $ 41

Chainlink (LINK)LINK doesn't need any introduction; it has a great project, a great community, and has also given great growth. It seems the corrective wave has ended at 0.382 Fibonacci retracement and now the price is about to break the consolidation triangle-shaped area. Let's see how things unfold.

LINK Marines - Assemble!The LINK Marines really need to rally around their token in order to save the day!
We still remain on our bullish count which is shown on the chart, the a-b-c correction was a little more difficult to count than in other altcoins but nevertheless this wave movements don't look bad.
The unsettling and interesting detail in Chainlink is that we touched the 0.786 retracement perfectly a few hours ago and heavily pushed back since then. This may be very well a good start for our projected wave (iii) but the price needs to build up a lot of bullish momentum in the next days, and we absolutely shouldn't remain at these low levels in the future.
Keep in mind that our bearish alternative of a lower Cycle Wave (2) is still in place because Chainlink established a tough horizontal channel which lasted nearly 300 days as of now. Seriously, look it up on the chart and see it for yourself, it's kind of impressing...
The support at 5.39$ is crucial for our bullish count, and it would mean very bad news for our fellow Chainlink Holders if this level is breached. I can assure everyone on here that we are watching this very carefully and will update you guys if needed!
Please note that we are already invested in Chainlink since the 20th of June and 14th of February 2023, back then we announced our first positions here on tradingview.
If you should have any questions whatsoever, you can write a comment or contact me directly!
Long #1 Chainlink ( LINKUSD )
AVERAGE EXECUTION PRICE: 6.17$
STOP-LOSS: NONE
LONGERM Target: +90$
Long #2 Chainlink ( LINKUSD )
AVERAGE EXECUTION PRICE: 6.58$
STOP-LOSS: NONE
LONG TERM TARGET: +90$ and more

#Chainlink ripping to over $10 before you know itLOOK at that #HVF
#LINK is a go!!!
after a YEAR long consolidation
and red candles should be bought up
Longing your longs could also be fruitful!
@TheCryptoSniper
#HVF

Accumulation and Expansion Patterns for $LINKTriple digits is coming, accumulation is coming to an end

LINK: finally $8.0Markets are turning to the positive sentiment after inflation slows down in the US, however, they are still more oriented toward equities and major crypto coins like BTC, rather than other coins. Analysts are pointing that after a strong push in BTC price, the eye of investors is finally turning toward altcoins in order to maintain correlations and diversification of portfolios. Certainly, this point in time would be the one where LINK might benefit significantly. On a positive side is that currently LINK is making small progress toward higher grounds, still managing to hold its price relatively stable.
During the previous week, the price of LINK was moving in a relatively short range, from $7.0 support up to $7.5 short term resistance line, however, as of the weekend, the price managed to finally reach the resistance line at $8.0. RSI was pushed from levels above 50, toward 62, indicating potential path toward the overbought side of the market. Moving average of 50 days modestly started to converge toward the MA200 counterpart, but it still does not indicate a potential cross in the coming period.
Support line at $7.0 has been tested for a third week in a row, and without strength to break it, the coin managed to revert toward the $8.0 resistance line, supported by the market demand. RSI has still not reached a clear overbought side, which leaves some space for the price to hold $8.0 resistance. LINK will start the week ahead by testing this level. There is currently a lower probability that this level might be breached. On the opposite side, there is some probability for $7.50 support to be tested for one more time, with low probability for $7.0 support line.

$LINK rally soon?BIST:LINK has been consolidating for 338 days. Watch out for breakout at $9.65. Next resistance is seen at Fib 0.618-0.786 around HKEX:34 -$42.
Support at $5.50.
Trade cautiously / ingat.
#Crypto #Altcoin #LINK #Chainlink #Ingat

LINKUSDT ShortLink/USDT at the resistance zone and there is a bearish divergence in a multipule time frame.in my view price will do the retracement.

History Repeats Itself with LINK?I have two different trading channels highlighted on the chart. The first predates the post-corona bull market. The second shows a long period of consolidation on the Chainlink weekly chart.
The first channel lasted for a year before LINK exploded to ATH over $50. The second channel marks a year in May 2023. Chainlink has completed a full market cycle and if this period of consolidation matches the last one, we'll see some explosive moves upward from Chainlink sometime in the next six weeks. This upward move should find resistance at the 200MA, but that will also come about 2x from the current price point.
Enjoy, NFA.

Chainlink momentum shiftwhen the charts speaks for itself. no complex indicators or drawing needed.
10, 20, & 30 week EMAs crossing the 50 week SMA.

Bullish Flag on LINKUSD 1h Timeframe Bullish Flag on LINKUSD 1h Timeframe
There is no divergence on RSI which indicates that the trend is still going on

Bullish Flag on LINKUSD 1h Bullish Flag on LINKUSD 1h Timeframe
There is no divergence on RSI which indicates that the trend is still going on

link/usdmy target on link is 17-19$
we can see massive accumulation on the chart
i hope it would be bullish
