LINK 3Q Forecast | SalamanderLINK is ready for 3-4Q bullrun. It is in my TOP 4 #musthodl coins in portfolio. I make no mistakes.
It may be volatile, but the result will be in +-50% gap
LINKBULLUSD trade ideas

LINK preparing for a face melting rally- almost a six-month long consolidation
- once breakout is confirmed, LINK easily reaches at least 20$
- staking coming in December

LINK may be breaking up from triangle; nearing daily goldencrossLooking at the weekly chart here to get a better view of this pink triangle’s trendlines. We can’t see on this chart how close the daily charts golden cross is from happening but it appears to be less than a few daily candle closes away from occurring. If this symmetrical triangle confirms its bullish breakout the target is around $11.32- $11.47. Reaching this target would bring price action up out of a much larger triangle that its been in for far longer that has a much larger breakout target to go with it, however we can see the stoch rsi on the weekly chart has ventures into the overbought zone so it increases the odds that when price action first retests this yellow trendline on the way to the target it will encounter it as resistance, same with the descending white trendline as well. The stochrsi is also overextended on the 1 day chart too increasing the probability that price action will encounter resistance along the way to the breakout target that may result in some level of correction. Still always possible it finds a way to break through both of these resistance lines with ease just a lower probability with stoch rsi already in the overextended zone. If it can sustain the breakout and reach its full breakout target then I believe it will sustain the daily chart golden cross and in time trigger the breakout from the much larger triangle pattern as well. *not financial advice*

LINK/USD - Watch it burn and rise from the ashes- Last idea was spot on (Short at 27).
- Last idea was entirely based on the cycle being over.
- Current cycle is bearish
- Hope for $5ish to accumulate as much as I can.
- Watch LINK rise to become a 100B asset and top 5 mainstay by 2024.
My ideas do whatever you want to do.
✌️

link breaking out hour/2 hour link breaking out of most recent pattern on the hourly as well as the 2 hour chart setting a higer low and should start the next leg towards previous highs or possible shoulder of the previous head and shoulders on the hourly. where we can re evaluate our positions and scale accordingly. COINBASE:LINKUSD interesting trade study will play out either way but for now staying bull.

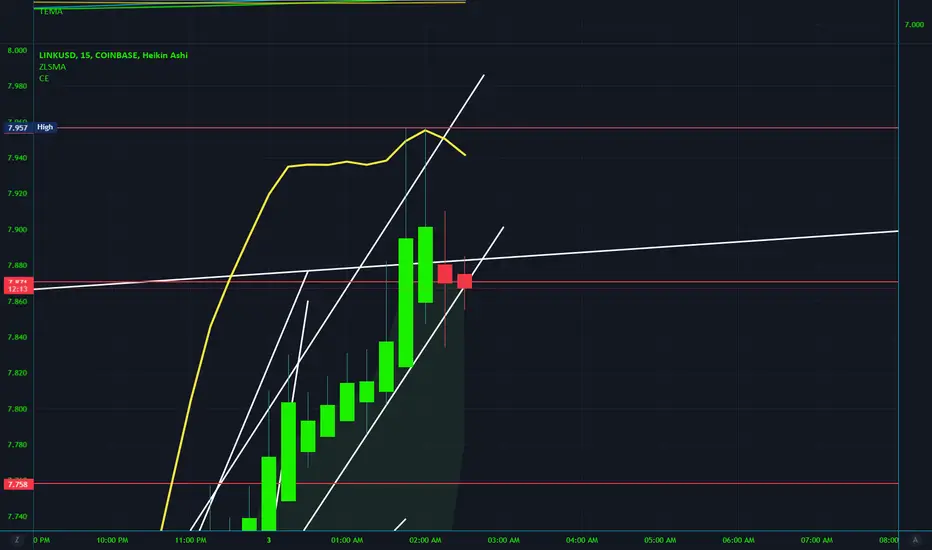
15 min chart, double top trend exhaustion Link chart after a nice bounce looking exausted to the upside and this most recent green candle appears to be a nice liquidity trap. clear defined stop loss at the high, target 1 is 7.70 - 7.75
A REALISTIC APPROACH TO 1000$ LINKHello Everyone, MrBanker is here. I present you with 3 ideas about how the LINK will reach 1000$.
First Theory:
- A 5 wave move is completed back in May 2021. Which also completed the 1st wave of the bigger degree.
- The LINK is now showing a rather complex correction which is also an accumulation zone.
- After this correction, we should observe a soaring move into 1000$ which will be only a fraction of the biggest 3rd Wave.
Second Theory:
- The indicator is especially customized for LINK in a Weekly timeframe.
- According to this indicator, LINK had two major tops and four major bottoms. Which also indicates a buy zone for LINK at this moment.
- For the LINK to reach 1000$ level, expect at least 1 year long minor bull and bear markets during that period. Which will be eventually shown in the custom made indicator.
Third Theory:
- Based on a realistic approach, LINK must first break through the ultimate resistance line starting from 2019.
- The upcoming CCIP and Staking will be great catalysts for a major pump. Considering that almost every LINK owner is waiting for Staking which will reduce the circulating supply drastically and increase the demand for the token enormously.
- By all these combinations of theories, LINK will definitely reach 1000 Dollars but the exact time is uncertain.
Trade Safe,
MrBanker

$LINK getting extremely close to a bullish 50/200 crossbar pattern is from last time it did a golden cross in early 2020


[UPDATE LINK] What can happen?Chainlink move:
Short term:
1) small pump up to 9-10$, dump
2) dump to the mid-range of the small range (7$), pump to 12-17$, deviation, then dump (during the staking december season)
Long term:
1) deviation, consolidate in the 4-6$ range, initiate new pump
2) consolidate in the 4-6$ range, final dump to may 2020 prices, consolidation, initiate new pump
This is true for link and for many other alts.

LINKUSD - Bat & Crab pattern pivots, FOMC, Elliot 5th WaveOn this chart, I've outlined some near-term thoughts re. Chainlink. On a higher time frame, this range is getting exhausted, and it may be time to move up. A potential inverse head and shoulders pattern targets $13 link. This week the FOMC could factor into the development of a 5th Elliot wave.

wyckoff accumulation spotted in Chainlink.Chain-link all set for ATH in 2023. Wyckoff accumulation spotted in Chainlink. ready for the melt up

LINKUSD (1H) - Bullish breakoutHi Traders
LINKUSD (1H Timeframe)
The market is in an uptrend and we are waiting for an entry signal to go LONG above the 7.86 resistance level. Only the downward break of 7.49 would cancel the bullish scenario.
Trade details
Entry: 7.86
Stop loss: 7.49
Take profit 1: 8.08
Take profit 2: 8.44
Score: 9
Strategy: Bullish breakout

Financial Wave. LinkLINK is declining in wave 4, target range is $7.35-7.40. A rise above $7.85 will cancel this scenario.

LINK: Is $8 the next target?Although the previous week was a positive one for the crypto market, still the moves made could be perceived as incremental. LINK was also following that general market sentiment and managed to cross the resistance line at $7, by reaching its highest weekly level at $7,6. Next resistance line at $8 has not been tested on this occasion.
RSI was pushed from level of 45 up to 57, which indicates that the market had turned its eye toward the overbought side. Moving average of 200 days is modestly approaching toward its MA50 counterpart, but the golden cross is still far away.
Current charts are suggesting an increased probability that the $8.0 resistance line might be tested in the coming days. At this moment there is no indication that this resistance line could be breached to the upside. On the opposite side, there is some probability for the $7.0 support line to be tested for one more time in the week ahead.

Link end to end security in mining ⚒ Bullish pennant
Chainlink provides reliable tamper-proof inputs and outputs for complex smart contracts on any blockchain. Smart Contracts provide the ability to execute tamper-proof digital agreements, which are considered highly secure and highly reliable. In order to maintain a contract's overall reliability, the inputs, and outputs that the contract relies on also need to be secure. Chainlinks provide a reliable connection to external data, that is provably secure end-to-end. The company was founded in 2014 and based in Grand Cayman, Midland, Cayman Islands

LINKUSDif eth runs eth ecosystem coins should also?
everything looks like late rallying here but unsure how the follow through will be..
decent r/r plays depending on risk tolerance
harmonics appear to get pattern countertraded as much as the usual fallingwedge/bull/bear pennant structures in crypto lol
or im just not v good at finding them yet aha
anyways udpated chart..

LINK AnalysisHello Dear, as we can see in the chart, Link kind of broke the daily down trend line but it's not moving toward upper resistance yet.
instead formed another dynamic downtrend in which is clearly visible in 4h timeframe.
If it breaks that up and give us confirmation, we can go long. otherwise we are short now.

LINK: time for short reversalFor some time charts were pointing toward a $6.5 short term support line which needed to be tested, and finally, LINK managed to reach this level during the previous week. The coin had to test this level in order to revert shortly back to the upside. LINK started the previous week at level of $7.3, which is the highest level reached during the previous week.
RSI tried to reach level of 50, but it soon reverted to the downside and lowest level around 38. The markets are still standing closer to the oversold market side, without a strength to make a breakthrough to the opposite side. Moving average of 50 days continues to move closer to its MA200 counterpart, with a decreasing difference between two lines. This is a positive movement, as it points to some potential for a golden cross to occur in the short future period of time.
Current charts are pointing to the $7.0 resistance line, which should be tested in the coming period. Whether this level will be broken to the upside, is unclear at this moment. First it should be taken into account that there are generally decreased trading volumes on the crypto market. Investors are reluctant to enter into position, due to unstable macro fundamentals. On the opposite side, there is lower probability for LINK to test the $6.5 short support line for one more time.

LINK: Cycle Bottom in at $4? LINK has crashed more than 90% from ATH, and I think the cycle bottom could be close. LINK could be trading in a 1:1.618 WXY correction with the bottom target being at $4. I wasn't sure how to dissect the past few months of sideways trading except labelling it as a possible wycoff accumulation with a secondary test coming. $4 also happens to be a high volume node on the volume profile. Ideally, I would like to see the Weekly RSI hit oversold territory, before calling a bottom.
I don't think SPX has bottomed yet especially with US10Y ripping to the upside. Still have my eyes set on $3,200. Big Tech earnings next week could be the catalyst to start the cascade to the downside.

#btcstarburst The world is Moving? ChainlinkThe world is moving… Is chainlink a good buy? Accumulate maybe… Chainlink is tied to many things, during the last Bull Market Link was will on its way to $100-$300…. What is its real value… This remains to be seen In the next ten years when full adoption takes place Link will probably be a BEAST… a minimum of at least $100+ not to mention the staking options. Some say $1000 this could easily be possible so $500 maybe a better shot..this is a study. DCA safely. CHAINLINK NEEDS ITS TURN TO RUN SOME TIME SOON!! LONG TERM…

LINK Potential Sign of Weakness Between $4.80 and $4.05Hi Everyone! This looks like we could still see a Sign of Weakness in Phase E of Distribution to a price point somewhere between $4.80 and $4.05. However, it may take its time about doing this. We are waiting for "both" Red AND Blue Lines to fall below Yellow Level 50 in the 9-Day and 2-Week time frames to create cause for Stage 1 expansion down.
Here is our Short Term Group of time frames:
Here is our Near Term Group of time frames: The Blue Line in the 6-Day may still hold us back from seeing a significant move to the downside all of a sudden. Mainly for how far it has yet to move down below Yellow Level 50. The 6-Day is top right of center on this chart. This looks like a slow bleed down due to how much work the Blue Line has to do to get below Yellow Level 50 to create EXPANSION down.
I hope this analysis was helpful.
Happy Trading and Stay Awesome!
David
