LOOMBTC | MRMEGBINANCE:LOOMBTC
Follow and like to see more Analyze for coins in Binance
www.tradingview.com
LOOMBTC trade ideas


LOOMBTC Market Update."In the name of Allah, the Most Gracious, the Most Merciful".
LOOMBTC Market Update.
Note: This is only for Educational purposes; this is not investment advice.
"Pain is silence"
Thanks
Adil Khan.


LOOM/BTC LONGLOOM/BTC
BUY
Open 326;
SL 314;
TP 375;
Risk/Reward: 1/4.08
By analogy with yesterday's RCN move. Fibo rebound 0.618. There is also a breakthrough in the trend and the candles look good.

$LOOM, Start retracing losing ~370 sats level $LOOM
Start retracing losing ~370 sats level (not support cause it never flipped it)
UCTS turning red across multiple timeframes // RSI leaving overbought levels
Aiming for ~320sats for a new evaluation of the chart
If you are hodling this for some reason, stay safe
#LOOM


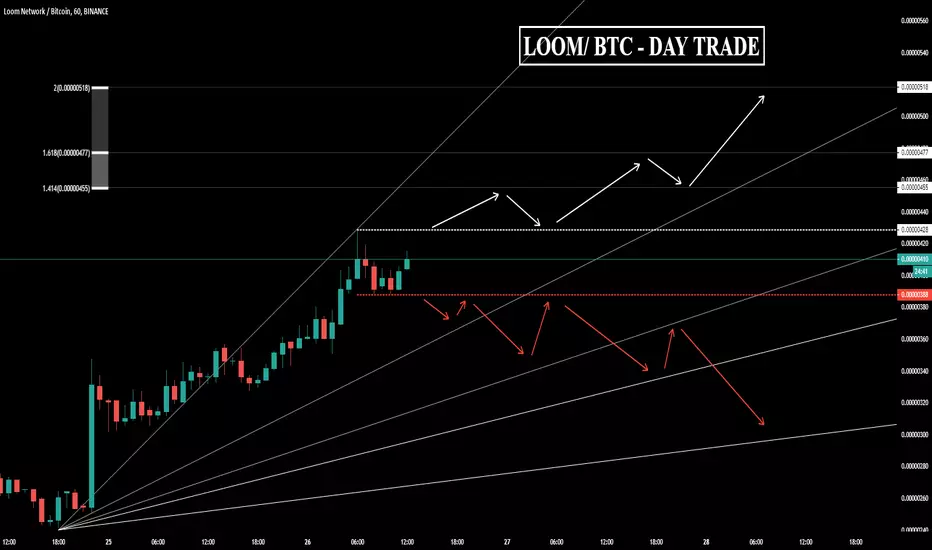
LOOM/BTC - DAY TRADEHi, today we are going to talk about LOOM and in a Day Trade opportunity.
We observe a 60M chart, some important points such as supports and resistances (and levels of strength) to the Day Trade. The details are highlighted above.
Thank you for reading and leave your comments if you like.
Join the Traders Heaven today, for more exclusive contents!
Link bellow!
Disclaimer: All content of Golden Dragon has only educational and informational purposes, and never should use it as financial advice
LOOM: Looking Better Than MostWe noticed a significant trading breakout might be taking place in LOOMBTC.
The recent trend is for altcoins to retrace 23% of their recent down moves. Like many bear market rallies, these up moves have been tremendous and very short-lived. So, you have to jump on the up move while you can.
In this case, LOOMBTC has taken out previous support near 362 and could be headed for the 23% retracement of its substantial down move. That level is up at 654.
Bottom Line: If you like LOOMBTC, you can try and buy a dip if there is a return move to 362. If you love LOOMBTC, then you can try to FOMO in betting it rips to 654. If LOOMBTC closes below 362, that would give us pause.

loom uprising is a correctionloom is not finished it's downtrend but I can see we have good correction here
today's powerful candle is a start of this correction and loom wants to see 500sat

Loom Network Says Bullish On The Chart!You might be looking at many tiny red and blue squares, or a bunch of random symbols on a screen on different colors...
To me, here it says bullish in many ways... I can see the following signals:
Break above EMA10.
Increasing bull volume.
The downtrend line is broken.
Moving below support to hit a new ATL just to quickly move back up.
Market cycle...
We are likely to see LOOMBTC grow by over 60% soon... and then some more...
Thanks a lot for reading.
Namaste.

$LOOM, Trying to breakout from descending trendline$LOOM
Trying to breakout from descending trendline as it bounces from ATL BTC tight range...
Volume slightly increasing..
Setting some alerts in case it explodes...
#LOOM

Loom Network (Sept 20) #LOOM $LOOM #BTC $BTCBuy : Close to 230 as possible
Sell : 250-275-300
Mid-Hold : 350
Stop : 200

Loom looking good for longBuy at 223
Stop Loss: 200
1st resistance: 269
2nd resistance: 320
3rd resistane:399
Target 290 -310


LOOM/BTCCan it be supported in this price range?
If it is not supported it will fall to the bottom of the channel but if it is supported it can make a good profit

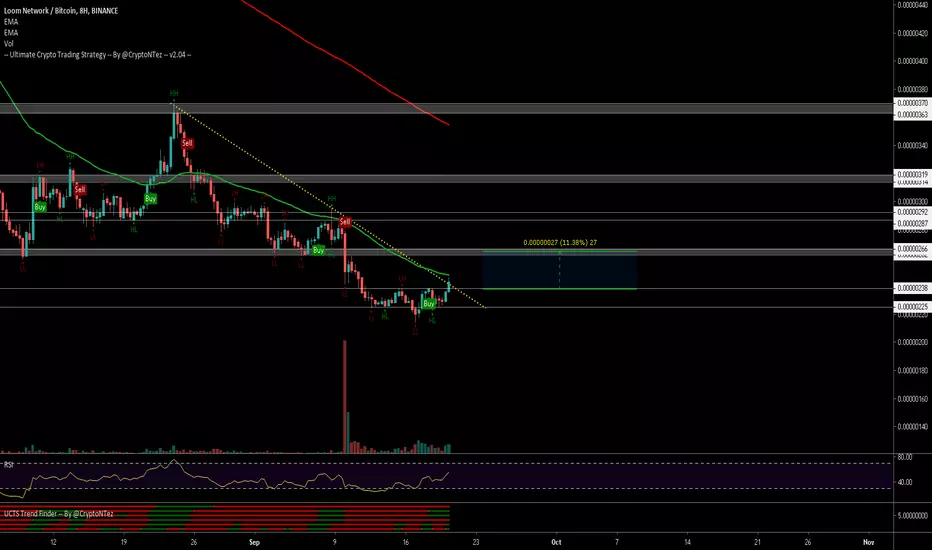
$LOOM, Falling wedge breaking out & crossing above ~320sats$LOOM
Big Picture: Falling wedge breaking out & crossing above ~320sats resistance
Zooming in:
UCTS Buy signal on the 12H (and every LTF)
RSI & MACD bullish divergences
Volume in binance is not that good so use a tight SL just in case..
As targets ~345/370/390sats
#LOOM

Trend ReversalAfter closing 10 straight days in red, the currency formed a possible reverse trend background on D1. RSI points to a small bullishness that can make good profits in the coming days.

