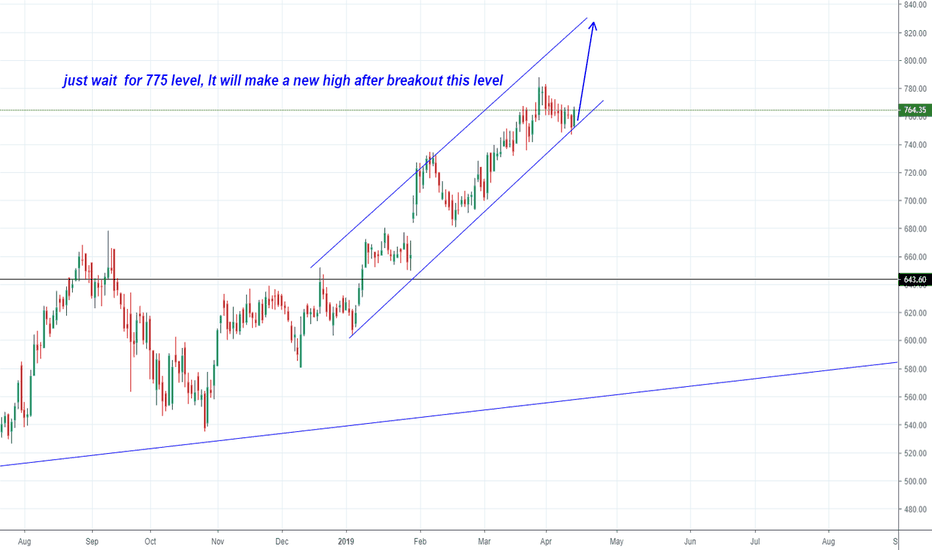
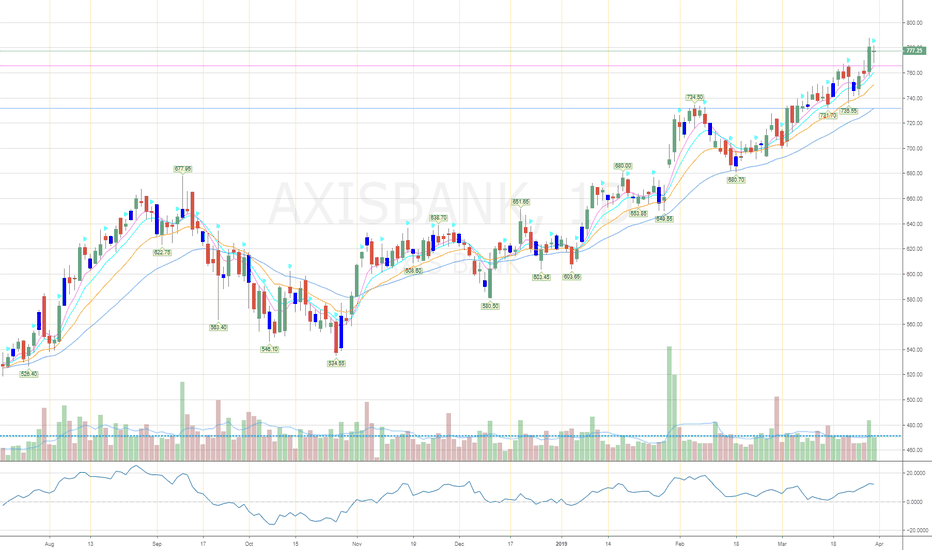
AxisbankAxisbank Trades using Blue Sky Plus Indicator. Spend less time in doing analysis. Just plain follow the indicator. Message or Comment to get a trial of the indicator. Shortby Franklinm1
AXIS BANK (SHORT TO NEUTRAL)Here we can see, Axis Bank formed a bearish divergence on MACD.By which,it has corrected from its all time highs.Currently as per dow theory,Axis bank is making lower low s and lower highs on Daily Chart .We can expect Axis bank to reach at 660-675 levels.However be aware that Axis Bank is in uptrend on weekly chart,it can anytime resume its upward flow.We can think of selling calls above its swing high i.e 792.As per its current IV(which is high as per current market) , we can think of selling calls above 792..i.e 800 strike calls.I recommed to use only 3 percnt of capital.As per LTP of Axis Bank -30-05-2019 800 CE LTP 7.40, we can get 6.43 % gross return on our margin employed. Also,start covering your position at 80% profit(premium decay) or limit your loss if daily candle closes above 779. Rest ,i will update as per its chart i.e when to readjust,when to change our view then what and how to sell. HAPPY TRADING.Shortby supertraderdeva11
Axis Bank - Short term bearishDescending Triangle on 1H = Bearish 1. SHORT if goes below 758 Target 743 SL 771 2. If on market open it is positive but weak short around 768 Target 743 SL 774 Shortby CryptoMehta0
Axis Bank685-670 appears to be a Demand zone because of the Breakout Gap. One should accumulate the stock in this zone for a new high!Longby CourtroomInvestmentsUpdated 1
Axis Bank: Short Set up.Axis Bank seem to have completed a wave move on monthly charts. Wave 2 is a flat and wave 4 is a traingle. Wave 5 is an ending diagonal pattern. The upside looks near to complete. One can take short position now and add on every rise with a closing stop loss of 770. Expect a decent correction in axis bank in coming weeks and months.Educationby NileshThete1
AXIS BANK (Short)There is a bearish divergence in RSI.So if AXIS bank break 700 level then it will show 680 level.Educationby ommjitu1
Expiry strategy: Sell Axis Bank Feb 660 Pu@t Bullish trend confirmed by EMA. And recent consolidation would help the price to stay above the gap formed on 30 Jan 2019. Sell Feb 660 Put @ 1. Lot size: 1200.Longby vigneshwarajUpdated 2
Axis Bank, Breakout Target 1000+Hello Friends, Axis Bank breakout was called in the Telegram Channel (Check my signature) Posting here as well. Triangle breakout and Target is 1100. One can invest now CMP and buy on dips till 660, Target : 1100. Sl can be below the 580 levels.Longby maheswar811
Axis Bank near bearish butterfly zoneOn daily charts Axisbank forming bearish butterfly zone. Stoploss and target on graph. Seeing no big difference in forming stoploss with 2 ATR.Shortby HumbledByMarketUpdated 112
BAT formation in 15 min chartWe may get high of longer term PRZ 727 with this lower time frame bluish bat formation. target 1 / stp in graph. target 2 727. Longby HumbledByMarket223
AXIS Bank - Sell We can see AXIS bank almost reached the so called resistance level or supply zone. We could see a short term sell here.Shortby NavaneetKrUpdated 1