LTC/USDT Descending Triangle Breakout with Retest OppurtunityKey Observations
1. The chart illustrates a Descending Triangle breakout, where the price has successfully moved above the descending trendline, confirming a bullish continuation.
2. The breakout has brought the price above the horizontal resistance zone at $115, which now acts as support.
3. A retest of the breakout zone ($115–$116) could provide an ideal entry opportunity for buyers.
Strategic Implications
Monitor the price action closely around the $115–$116 level for signs of a successful retest. If the support holds, it may lead to further upside, with the next target zone around $130–$140, aligning with previous highs. Use a stop-loss below $110 to manage risk effectively, as a breakdown below this level would invalidate the bullish setup. Look for volume confirmation during the retest to reinforce the strength of the breakout.
LTCBULLUSDT trade ideas

Litecoin
#LTC just confirmed a good monthly close above its breakout zone 🚀
Now targeting key levels:
🎯 $199.64
🎯 $243.13
🎯 $282.02
The bullish momentum is building, and this breakout signals strong upside potential. Don't miss the move! 👀

LTCUSDT - Whats Next?Litecoin again is in such a way where hedge mode players can come into action. Here the green line is ideally a point of similar buyers action onto play, now the purple line is what will happen. 1.) If the coin goes direct on the red line and closes ecpect the next purple line in action making big one shot candle 2.) If buyers slit by the blood of BTC expect it slowly bleed to the yellow line. BUT hedgers can hedge and take play of both the momentum and release one when the other goes out and Vice Versa.Most likely a choppy one.Overall i wont take scalp longs so i am putting bearish and waiting for the yellow box to get activated for my buys!

LTC looks good to long till 120.LTC shows very very very very huge probablity of getting a inside candle and boom to 120 usd as said and shown in the charts!

LTC/USDT Short-Term Breakout Confirmed !LTC/USDT has broken above a key descending trendline resistance, signaling a bullish breakout. The price is now retesting the $115-$116 zone, flipping it into support. A successful hold above this level could lead to a rally toward the next resistance at $140-$147. Traders should monitor the $100-$105 support zone in case of a pullback. This breakout shows strong potential for upward momentum in the short term.

LTC/USDTKey Level Zone : 110-111
HMT v4.0 detected. The setup looks promising, supported by a previous upward/downward trend with increasing volume and momentum, presenting an excellent reward-to-risk opportunity.
HMT (High Momentum Trending):
HMT is based on trend, momentum, volume, and market structure across multiple timeframes. It highlights setups with strong potential for upward movement and higher rewards.
Whenever I spot a signal for my own trading, I’ll share it. Please note that conducting a comprehensive analysis on a single timeframe chart can be quite challenging and sometimes confusing. I appreciate your understanding of the effort involved.
Important Note :
Role of Key Levels:
- These zones are critical for analyzing price trends. If the key level zone holds, the price may continue trending in the expected direction. However, momentum may increase or decrease based on subsequent patterns.
- Breakouts: If the key level zone breaks, it signals a stop-out. For reversal traders, this presents an opportunity to consider switching direction, as the price often retests these zones, which may act as strong support-turned-resistance (or vice versa).
My Trading Rules
Risk Management
- Maximum risk per trade: 2.5%.
- Leverage: 5x.
Exit Strategy
Profit-Taking:
- Sell at least 70% on the 3rd wave up (LTF Wave 5).
- Typically, sell 50% during a high-volume spike.
- Adjust stop-loss to breakeven once the trade achieves a 1.5:1 reward-to-risk ratio.
- If the market shows signs of losing momentum or divergence, ill will exit at breakeven.
The market is highly dynamic and constantly changing. HMT signals and target profit (TP) levels are based on the current price and movement, but market conditions can shift instantly, so it is crucial to remain adaptable and follow the market's movement.
If you find this signal/analysis meaningful, kindly like and share it.
Thank you for your support~
Sharing this with love!
HMT v2.0:
- Major update to the Momentum indicator
- Reduced false signals from inaccurate momentum detection
- New screener with improved accuracy and fewer signals
HMT v3.0:
- Added liquidity factor to enhance trend continuation
- Improved potential for momentum-based plays
- Increased winning probability by reducing entries during peaks
HMT v3.1:
- Enhanced entry confirmation for improved reward-to-risk ratios
HMT v4.0:
- Incorporated buying and selling pressure in lower timeframes to enhance the probability of trending moves while optimizing entry timing and scaling

LTCI just jumped into a **long trade on LTC**, and I thought, why not share it with you guys?
Maybe we can all ride this wave together! 🚀
I based my move on a **strategy involving price channels**. The price was sliding down within a descending channel, but then—**boom**—a breakout occurred, forming an ascending channel at the same time. Perfect setup!
Targets are clearly marked on the chart. 🎯 As for my **stop loss**, I’ve placed it just below the big red channel, You could place your stop loss below the blue ascending channel, but I wouldn’t recommend it—it’s too prone to price manipulation. Below the red channel’s edge? Much safer, much smarter.
Trade smart, have fun, and enjoy the ride, folks! Happy trading! ⚡
BINANCE:LTCUSDT COINBASE:LTCUSD CRYPTO:LTCUSD BYBIT:LTCUSDT

Ultimate Movement from LTCBINANCE:LTCUSDT
LTC can reach it's glory days in mid term!
I expect a sharp movement in the coming months!
some important resistance zones are shown on the chart!
⚠️ Disclaimer:
This is not financial advice. Always manage your risks and trade responsibly.
👉 Follow me for daily updates,
💬 Comment and like to share your thoughts,
📌 And check the link in my bio for even more resources!
Let’s navigate the markets together—join the journey today! 💹✨

Could LTC experience an XRP-like move?Here’s a revised version of your market analysis:
An intriguing setup is unfolding for LTC, with potential for a substantial price movement reminiscent of XRP’s previous explosive rally. In the minor timeframes, a cup-and-handle pattern appears to be forming, signaling bullish momentum if the setup confirms.
The key observation is the breakout above the highlighted resistance zone, which could act as a catalyst for the next leg up. The structure aligns with a larger bullish framework seen in the weekly chart. If LTC sustains its trajectory and respects the pattern dynamics, higher targets, as indicated in the chart, could be achievable.
Short-term projections hinge on how LTC performs at key resistance and support levels. Monitoring the handle consolidation and volume during the breakout will be critical to validate the continuation.
Let me know if you’d like further technical details or projections!

LTC/USDT "Litecoin vs Tether" Crypto Market Bullish Heist Plan🌟Hi! Hola! Ola! Bonjour! Hallo!🌟
Dear Money Makers & Robbers, 🤑 💰
Based on 🔥Thief Trading style technical and fundamental analysis🔥, here is our master plan to heist the LTC/USDT "Litecoin vs Tether" Crypto market. Please adhere to the strategy I've outlined in the chart, which emphasizes long entry. Our aim is the high-risk Red Zone. Risky level, overbought market, consolidation, trend reversal, trap at the level where traders and bearish robbers are stronger. Be wealthy and safe trade.💪🏆🎉
Entry 📈 : You can enter a Bull trade after the breakout of Resistance Level.
however I advise placing Buy limit orders within a 15 or 30 minute timeframe. Entry from the most recent or closest low or high level should be in retest.
Stop Loss 🛑: Using the 2H period, the recent / nearest low or high level.
Goal 🎯: 120.00
Scalpers, take note 👀 : only scalp on the Long side. If you have a lot of money, you can go straight away; if not, you can join swing traders and carry out the robbery plan. Use trailing SL to safeguard your money 💰.
Warning⚠️ : Our heist strategy is incompatible with Fundamental Analysis news 📰 🗞️. We'll wreck our plan by smashing the Stop Loss 🚫🚏. Avoid entering the market right after the news release.
Fundamental Outlook 📰🗞️
Based on the fundamental analysis, I would conclude that the LTC/USDT (Litecoin/Tether) pair is: Bullish
Reasons:
Adoption and usage: Increasing adoption and usage of Litecoin, particularly in the payments and e-commerce sectors, could drive up demand and price.
Technological advancements: Ongoing technological advancements, such as the implementation of the MimbleWimble protocol, could improve the scalability, security, and usability of the Litecoin network.
Halving event: The upcoming halving event, which reduces the block reward from 25 LTC to 12.5 LTC, could lead to a decrease in supply and increase in price.
Market sentiment: A shift in market sentiment, particularly among institutional investors and traders, could drive up demand and price.
However, it's essential to consider the following risks:
Regulatory uncertainty: Uncertainty and potential regulatory changes, particularly in the US and China, could negatively impact the price of Litecoin.
Competition from other cryptocurrencies: Increasing competition from other cryptocurrencies, particularly those with similar use cases and technological advancements, could negatively impact the price of Litecoin.
Security concerns: Security concerns, such as the potential for 51% attacks or other vulnerabilities, could negatively impact the price of Litecoin.
Bullish Scenario:
Increasing adoption and usage of Litecoin, particularly in the payments and e-commerce sectors, drives up demand and price
Technological advancements, such as the implementation of the MimbleWimble protocol, improve the scalability, security, and usability of the Litecoin network
Please note that this is a general analysis and not personalized investment advice. It's essential to consider your own risk tolerance and market analysis before making any investment decisions.
Take advantage of the target and get away 🎯 Swing Traders Please reserve the half amount of money and watch for the next dynamic level or order block breakout. Once it is resolved, we can go on to the next new target in our heist plan.
Keep in mind that these factors can change rapidly, and it's essential to stay up-to-date with market developments and adjust your analysis accordingly.
💖Supporting our robbery plan will enable us to effortlessly make and steal money 💰💵 Tell your friends, Colleagues and family to follow, like, and share. Boost the strength of our robbery team. Every day in this market make money with ease by using the Thief Trading Style.🏆💪🤝❤️🎉🚀
I'll see you soon with another heist plan, so stay tuned 🫂

Ltc/breakout?I was looking for a lower low, but most coins are starting to break to the up side. So I am cautiously watching, because we are at a turning point.we should know in a few days. I will update tomorrow to see if the chart has changed.
At the moment I will call long untill I can see a update on the daily chart.

Long trade
5min TF entry
15min Structure
Buyside trade
5min TF Entry
Jan 1st Jan 24
5.30 am
LND Session AM
Entry 104.12
Profit level 106.10 (1.90%)
Stop level 103.90 (0.21%)
RR 9
Reason: Observation of price action since 30th Dec 2024 seems indicative of buyside momentum at this time.

LTCNice and clear
I don't need to even explain here it says it all short til the bottom line parallel or if it breaks back to beginning of this decsending channel
Enjoy 2025
Good luck

LTC is about To do a Bullish movement!The price can increase again from here and rise up to the measured move.
Give me some energy !!
✨We spend hours finding potential opportunities and writing useful ideas, we would be happy if you support us.
Best regards CobraVanguard.💚
_ _ _ _ __ _ _ _ _ _ _ _ _ _ _ _ _ _ _ _ _ _ _ _ _ _ _ _ _ _ _ _
✅Thank you, and for more ideas, hit ❤️Like❤️ and 🌟Follow🌟!
⚠️Things can change...
The markets are always changing and even with all these signals, the market changes tend to be strong and fast!!

Long trade
2min TF Entry
Buyside trade
2min TF Entry
Sun 29th Dec 24
6.35 pm
NY to Tokyo Session PM
Entry 98.34
Profit level 102.65 (4.38%)
Stop level 97.74 (0.61%)
RR 7.18
Reason: Observering of price action since Sat the 28th and reaching a pivotal demand zone indicative of a buyside trade.

LITECOIN- LTC - Long LITECOIN - Long scenario: Take the liquidity below and bounce from Weekly FVG.
TP at $150 when price take this daily swing high

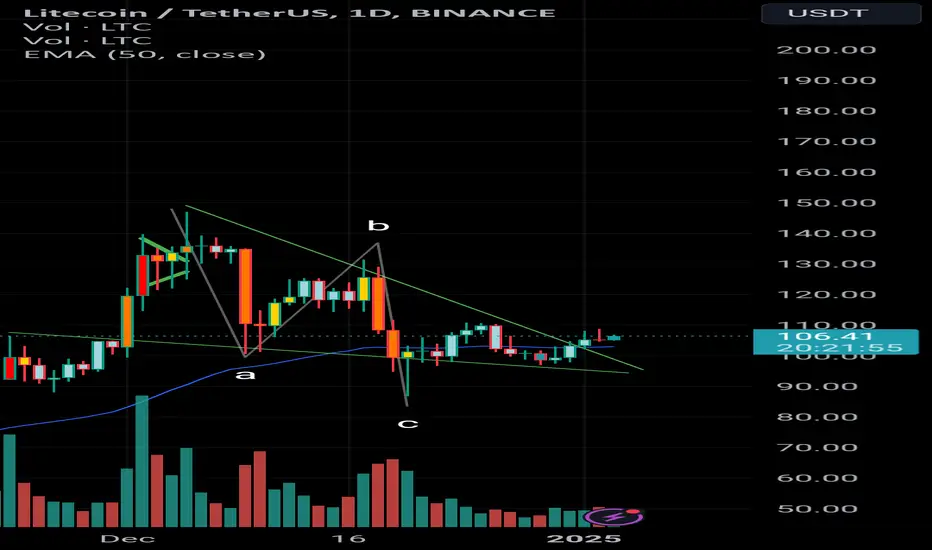
LTC/USDT Trading Scenario UpdateAgainst the backdrop of overall optimism in the cryptocurrency market during November and early December, LTC showed confident growth, reaching a price level of $147.32. This was followed by a correction exceeding 40%.
Interestingly, the asset's price retraced and rebounded from the upper boundary of a consolidation range that has persisted for over two years. This range has become an accumulation zone for a significant number of participants and continues to attract new ones, as LTC is trading in close proximity to this level.
Given the current dynamics, further developments in the altcoin market could be anticipated, with the potential for a strong upward trend and a possible multi-fold growth.

LTCUSDT: Huge Potential on thisA Cyclic check on LTC's last boom implicates a truly huge growth potential.
Since making it out of the the symmetrical triangle in 2017 so far, 2,738 days has been passed.
The channelized price movement shows a steady build up of consecutive Higher Lows as shown by little green upward arrows. This represents a healthy ecosystem regarding its applicability and public interest.
I estimate the growth potential for LTC to be about 1 K by late March. Compared to BTC, the LTCBTC abrupt is going to surprise many. I have already created a post on LTCBTC and only of an ETF is approved Litecoin can reach for the middle of the second channel somewhere around 7 - 8K.
Previously, by breaking up out of the symmetrical triangle in 2017, it took only 273 days for LTC to grow from 4 USD to some 400. This time though, I expect an elongated growth in between 18 to 24 months aiming 7K target.
The growth in Gold and Bitcoin Price is an indicator for a fundamentally healthy currency like Litecoin, denoting that the parabola has just been started.
Keep in mind that there are only 84 Millions of LTC and do not forget that just like its previous movement from 4 - 100 USD, a rational, wise and visionary investor cannot ignore Litecoin.
By the way, you need to scrutinize these arguments and find Correlations peered to facts.
There is difference between fortunetelling, forecasting and Futurology.
The volume seems suspicions of some serious plans that the whales might have for it.
DYOR. Not a financial advice.

Litecoin (LTC): Possible 20% Upward Movement To Happen!Litecoin has made a nice 25% drop since our last look at this coin. Now this time we are looking for a possible further 25% recovery from the current price but if we take a look at bigger timeframes, we are seeing one pattern repeat itself.
More in-depth info is in the video—enjoy!
Swallow Team

LTC Sweet buy levelPrice action of BYBIT:LTCUSDT has formed a perfect ABCD pattern and now it is sitting at a sweet buy zone retesting 0.5 Fib retracement level with potential to hit $405. Use spot to buy not futures. NFA. DYOR.

Valuable Demand Zone Amid Weak Market ConditionsLTCUSDT Analysis: Valuable Demand Zone Amid Weak Market Conditions
I believe the blue box in LTCUSDT is highly valuable as a demand zone. Given the overall market conditions are not strong , I’ve identified a lower entry point that aligns with more favorable risk-reward scenarios.
This blue box stands out due to its significance from multiple perspectives . I used heatmap , cumulative volume delta (CVD) , and volume footprint techniques to accurately define this zone as a potential buyer area.
Key Points:
Market Conditions: Currently weak, favoring conservative entry levels.
Blue Box: A carefully identified high-value demand zone.
Techniques Used: Heatmap, CVD, and volume footprint for precise demand mapping.
If you'd like to learn how I use these advanced techniques to define accurate demand zones, just DM me!
If you think this analysis helps you, please don't forget to boost and comment on this. These motivate me to share more insights with you!
I keep my charts clean and simple because I believe clarity leads to better decisions.
My approach is built on years of experience and a solid track record. I don’t claim to know it all, but I’m confident in my ability to spot high-probability setups.
If you would like to learn how to use the heatmap, cumulative volume delta and volume footprint techniques that I use below to determine very accurate demand regions, you can send me a private message. I help anyone who wants it completely free of charge.
My Previous Analysis
🐶 DOGEUSDT.P: Next Move
🎨 RENDERUSDT.P: Opportunity of the Month
💎 ETHUSDT.P: Where to Retrace
🟢 BNBUSDT.P: Potential Surge
📊 BTC Dominance: Reaction Zone
🌊 WAVESUSDT.P: Demand Zone Potential
🟣 UNIUSDT.P: Long-Term Trade
🔵 XRPUSDT.P: Entry Zones
🔗 LINKUSDT.P: Follow The River
📈 BTCUSDT.P: Two Key Demand Zones
🟩 POLUSDT: Bullish Momentum
🌟 PENDLEUSDT.P: Where Opportunity Meets Precision
🔥 BTCUSDT.P: Liquidation of Highly Leveraged Longs
🌊 SOLUSDT.P: SOL's Dip - Your Opportunity
🐸 1000PEPEUSDT.P: Prime Bounce Zone Unlocked
🚀 ETHUSDT.P: Set to Explode - Don't Miss This Game Changer
🤖 IQUSDT: Smart Plan
⚡️ PONDUSDT: A Trade Not Taken Is Better Than a Losing One
💼 STMXUSDT: 2 Buying Areas
🐢 TURBOUSDT: Buy Zones and Buyer Presence
🌍 ICPUSDT.P: Massive Upside Potential | Check the Trade Update For Seeing Results
🟠 IDEXUSDT: Spot Buy Area | %26 Profit if You Trade with MSB
📌 USUALUSDT: Buyers Are Active + %70 Profit in Total
🌟 FORTHUSDT: Sniper Entry +%26 Reaction
🐳 QKCUSDT: Sniper Entry +%57 Reaction
I stopped adding to the list because it's kinda tiring to add 5-10 charts in every move but you can check my profile and see that it goes on..

LTCI think there is no need to explain more about this idea 2 chance we have i don't care about first stop lost i am sure it will do that only there is nothing more
