LTC USD in bull market 2025 - 2026i use trend line and knowledge about trading, i guest LTC will up to 600 - 800 this bull session
LTCBULLUSDT trade ideas

Litecoin (LTC)Litecoin price today is $81 with a 24 hour trading volume of 920 million dollar. LTC price is up 7.0% in the last 24 hours
Litecoin is a peer2peer cryptocurrency created by Charlie Lee, a man who take advantage of working on first crypto exchanges aka Coinbase and dump most of his coins on first days of listing, became millionaire and quit his job! so technically LTC is just a simple fork of BTC
50-60 is a dip for ltc and good time to load some coins and 95-110$ is an important time for bulls and time to take good profit as well
Never FOMO on LTC and be ready for rejection and pullback at blue line level

Ltcusdt to 145Litecoin will go 145 per dollar very soon. I don't know what to say more than that. Like how do I know that price will reach that level? Ok because that's how price behaves

LTC Bulls are backBINANCE:LTCUSD.P Is at resistance and it will surely break it out if somebody want take entry at this price for scalp it is the best opportunity, #LTC is forming a cup and handle chart pattern inside this trend if it break out this trend the price will surely go 90-95$.

#LTCUSDT #1D (ByBit) Ascending wedge breakdown and retestLitecoin lost 100EMA acting as resistance now and is pulling back towards it, more retracement down seems likely on daily.
⚡️⚡️ #LTC/USDT ⚡️⚡️
Exchanges: ByBit USDT
Signal Type: Regular (Short)
Leverage: Isolated (5.0X)
Amount: 5.0%
Current Price:
64.32
Entry Targets:
1) 65.78
Take-Profit Targets:
1) 55.34
Stop Targets:
1) 71.01
Published By: @Zblaba
CRYPTOCAP:LTC BYBIT:LTCUSDT.P #Litecoin #PoW litecoin.org
Risk/Reward= 1:2.0
Expected Profit= +79.4%
Possible Loss= -39.8%
Estimated Gaintime= 1 month

Litecoin is Better than SilverThis trade fundamentally relies on the idea that capital will rotate from BTC and memecoins to old POW coins like LTC. Most likely to occur during summer.
Technically, i like the chart

SasanSeifi|Will It Break Resistance or Test Lower Supports?Hey there, ✌ On the weekly timeframe, BINANCE:LTCUSDT price movement, after ranging around $84, faced a downward trend and corrected to the $50 level. Currently, the price is trading in a range around $63 with limited fluctuations.
In the long-term weekly timeframe, key support levels for Litecoin are at $50 and $42. To continue the upward trend, it’s essential for the price to break the critical resistance at $85 and hold above it. If this resistance is broken, the likelihood of further price growth increases.
For a clearer understanding of the price movement, it’s crucial to closely monitor Litecoin’s reaction to the $70 to $85 range. If the price fails to sustain above these levels, we may see a correction and a potential return to the major support zones.
🔶The chart is in logarithmic scale.
This analysis reflects my personal view and is not financial advice. If you found this helpful, feel free to like and comment – I’d love to hear your thoughts! Happy trading! ✌😊

LTC / USDT - Looking at more lows in the medium termLTC Price Action Analysis:
LTC was expected to break out decisively and resume its upward trend a few weeks ago, but it now appears to be forming a larger WXY corrective pattern. However, the C-wave of Y isn’t perfectly fitting within the expected structure, leading to some uncertainty about its completion.
Currently, I’m holding onto this pattern as my primary outlook unless I see a MACD curl-up or a significant increase in volume, which would signal a potential upward move.
If Bitcoin (BTC) experiences another low before beginning its upward movement, there’s a high likelihood that LTC could also make new lows before resuming its upward trend. For now, I’m closely monitoring the signals for confirmation.

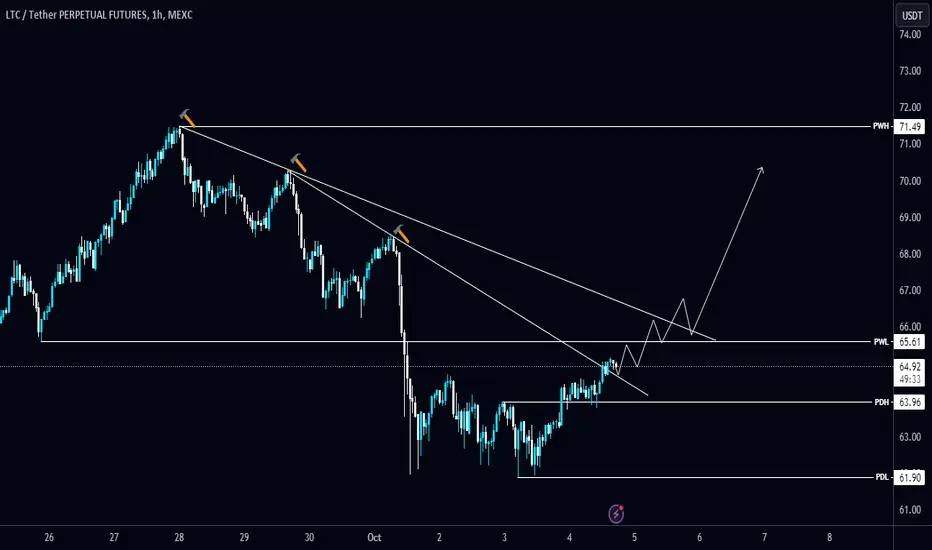
#LTC/USDT breaks the Diagonal Trendline in 1-Hour TF!#LTC/USDT breaks the Diagonal Trendline in 1-Hour TF!
Wait for a successful retest to long $LTC. The local resistance level is PWL $65.6 and the support level is $63.96.
Litecoin - LTC Free Fall to $60 ??Although Litecoin did not make the Top Altcoins for 2024 list - it is an old timer. And by this, I basically mean that it can (and will) still be traded.
From the 4h, we see some beautiful swings that can be very profitable trades, with the right entry points.
It seems the entire market is turning down following BTC. This however, could result in some good entry points and lower buying orders being filled. Getting in at the RIGHT price is one of Warren Buffet's key investment strategies. Find out more on that, here:
____________________________
BINANCE:LTCUSDT

LTC ANALYSIS (4H)LTC appears to be within a large corrective pattern such as a diametric or an expanding triangle.
If we look at LTC in more detail and refer to the hourly time frames, we see two liquidity pools at the top and bottom of the chart (which we denote by $$$).
The best range for the sell/short position is the red range.
Closing a daily candle above the invalidation level will violate the analysis.
For risk management, please don't forget stop loss and capital management
Comment if you have any questions
Thank You

Litecoin longLitecoin bounced off the ascending trendline and bounced off the support level. Bullish movement to resistance level at 70.3 is expected to happen.

Litecoin - Bullish Continuation - Support Trend Line - Fib LevelBINANCE:LTCUSDT is currently in a bullish trend and currently being supported by the support trend line.
4 Hr Analysis:
1. Bullish Trend (Dow Theory)
2. Support Trend Line
3. 0.786 Fib Support

LTCUSDT Breaks Resistance with Volume Surge: Is $100 Next?LTCUSDT has decisively broken through resistance with impressive trading volume, signaling a potential surge in the coming days. With momentum building, can LTC surpass its previous highs? The outlook is positive, and we're anticipating a move towards $100 soon.
Currently, it's facing minor resistance at the 200 EMA. Keep an eye on market trends and adjust your strategies accordingly, as this coin shows strong potential for upward movement!
LTCUSDT Currently trading at $70
Buy level: Above $69
Stop loss: Below $59
TP1: $76
TP2: $85
TP3: $100
TP4: $112
Max Leverage 3x
Follow Our Tradingview Account for More Technical Analysis Updates, | Like, Share and Comment Your thoughts

LTC Hard Pump incoming?sitting at 68$ major support
buying here heavy with stop loss
long term hold
if BTC remain above 65k ... a run to 110 is on the table and break of that too

Trading opportunity for LTCUSDTBased on technical factors there is a Buy position in :
📊 LTCUSDT
🔵 Buy Now
🪫Stop loss 64.00
🔋Target 1 75.00
🔋Target 2 81.50
🔋Target 3 81.50
💸RISK : 1%
We hope it is profitable for you ❤️
Please support our activity with your likes👍 and comments📝

Will Litecoin Break the Wedge Upwards?When the LTCUSDT 4-hour chart is examined; It is observed that the price movements continue within the upward sloping wedge. As long as the crypto's 62.56 level is not broken downwards, it is evaluated that the price movements above the 65.79 level can exceed the 69.41 level and target the 76.50 level.

LTCUSDT: Trend in weekly time framePlease pay special attention to the accurate trend, channel, triangle setup, and very accurate colored levels
Be careful
BEST
MT

Next Leg UpLitecoin is testing support & is likely to appreciate along with broader crypto market.
I'm entering long position on this one.

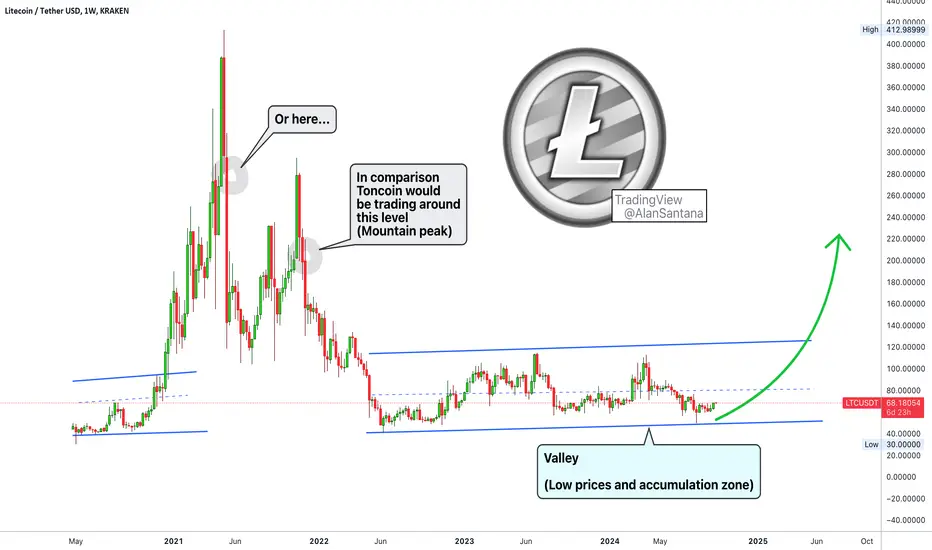
Litecoin vs Toncoin (Comparison)Hello my fellow reader, I would like to show you this long-term Litecoin chart to later compared it with Toncoin, for us to see the big difference between two big projects.
Litecoin is trading very low right now. The current price is the same level at which Litecoin traded back in November 2020, May 2022, November 2022, late 2023 and early 2024. This is a long-term accumulation zone. This level can be considered bottom prices and is good to accumulate in anticipation of long-term growth.
This level both preceded the 2021 bull-market and also worked as the bottom of the 2022 bear-market. Litecoin has been sideways since.
Please keep in mind this trade-idea as we move to the next one, Toncoin (TONUSDT).
Namaste.
LTC - LONG The chart shows a clear pattern of repeated growth cycles for the LTC coin. Each cycle starts from an accumulation zone (marked on the chart), followed by a strong impulsive upward movement.
What does this mean?
After each accumulation phase, we observed significant price increases of 63-78%. Now, LTC is again in the accumulation zone, which could indicate a potential breakout upward.
Potential target:
If the coin repeats its historical behavior, an increase of 60-70% from current levels is expected, which could lead to a price range of approximately $110-120.


#LTCUSDT #4h (ByBit) Broadening wedge breakout & retestLitecoin pulled back to 50MA support where a bounce seems likely, eventually leading to a bullish continuation.
⚡️⚡️ #LTC/USDT ⚡️⚡️
Exchanges: ByBit USDT
Signal Type: Regular (Long)
Leverage: Isolated (7.0X)
Amount: 4.8%
Current Price:
72.06
Entry Targets:
1) 71.83
Take-Profit Targets:
1) 80.39
Stop Targets:
1) 67.54
Published By: @Zblaba
CRYPTOCAP:LTC BYBIT:LTCUSDT.P #4h #Litecoin #PoW litecoin.org
Risk/Reward= 1:2.0
Expected Profit= +83.4%
Possible Loss= -41.8%
Estimated Gaintime= 5-10 days
