Litecoin Surges: Hidden Bullish Signals Hint at $175 TargetLike most other established altcoins, Litecoin has recently seen significant price gains. However, unlike the heavyweight contenders Bitcoin and Ethereum, LTC is still far from its all-time highs reached in 2021. Whether Litecoin will ever revisit these highs remains uncertain. Nevertheless, there is currently a clear and pronounced hidden bullish divergence visible in the CumulativeVolumeDelta on the weekly chart. Additionally, from the perspective of the Elliott Wave Theory, LTC has formed waves 1 and 2 and appears to be initiating wave 3. Based on the resulting Fibonacci ratios and the hidden bullish divergence, we derive a price target of around $175 for Litecoin.
LTCBULLUSDT trade ideas

LTC IS READY FOR A MASIVE MOVE!🚀CRYPTOCAP:LTC has recently bounced from its long-term support level which has held for 1900 days, as indicated by historical price interactions. It has broken out of the symmetrical triangle pattern and is currently being it, with $78 serving as support. In the past, when it previously broke out, it bounced around 500%, so we can expect a similar move this time too.
During this anticipated movement, it's important to note that there will be resistance at the $135 level, as well as the all-time high (ATH).
#DYOR #NFA

LTC I guess I'm a little obsessed with LTC. I think this is a possible scenario. The blue pattern represents RSR. I think LTC is a little behind him, but I believe something similar can happen. I believe that some news related to this coin will appear in the coming period. If BTC happens to make some price drop, it will be a good circumstance to buy. I'm currently long. position and it is already a big profit. As for the spot position, I think all this price is good to buy, DCA up to 80 usd, SL 76. There is a big range

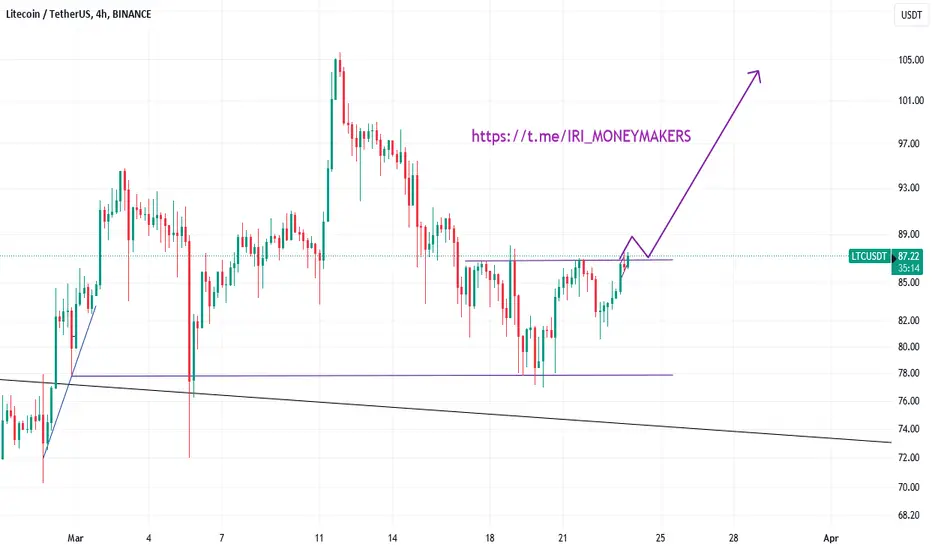
LTC USDTAs it's shown in the chart, in 4H time frame, with a break up the resistance price around 86.83$ and a consolidation candle above this price we expect an upward move at least to 106$.

LTCUSDT Elliott Waves Analysis (Investment idea)Hello friends.
Please support my work by clicking the LIKE button👍(If you liked). Also i will appreciate for ur activity. Thank you!
Everything on the chart.
Closest target: 200 - 400 - 800
Main(investment) target zone: 750 - 1000$
Cancellation of setup - decreasing under 40
RR: 1 to ~20
risk is justified
Good luck everyone!
Follow me on TRADINGView, if you don't want to miss my next analysis or signals.
It's not financial advice.
DYOR!


Litecoin(LTC): Bullish and Bearish Scenario!Litecoin has been dropping sharply and slowly moving towards the 100 and 200 EMA. With that being said, we have two possible scenarios here (bullish and bearish):
A bullish scenario would mean a nice bounce from 200 EMA and a movement toward the top, while a bearish scenario would mean a breakdown at 200 EMA and securing of that zone, which again would mean a potential free fall!
Swallow Team

$LTC breaking out a descending trianglePossible scenario where LTC could breakout a descending triangle. It stayed on the support line so far, both in the Daily and the 4h time the RSI supports the idea.
if it breaks up we can see #LTC reaching again the resistance of the bigger triangle at $102, and possibly break that to finally reach the ATH, First goal $120-$125.

[LTCUSDT] - very similiar scenario🔥LTC raised 600% in previous bull run after breakout .
we can notice in weekly chart that the same scenario repeat it's self.
successfull retest must be considerd to get 400% up.
so must keep it in ur watchlist.
don't forget to support us with ur like, comment and follow for more updates🎯

LTC heading back to $105?We may just have broken the downtrend after printing a double bottom as you can see from the chart, if we keep the bullish momentum we might see LTC retesting 105 in the coming days, if we break this resistance we'll go for the 115 next resistance zone,

LTCUSD 1WLTC ~ 1W 📈
#LTC Make purchases in stages from here, minimum target 25%. 🔼 Bulls will continue to Dominate as long as price is above this Resistance Line.

LTC: buy-low .. sell-high📊Analysis by AhmadArz:
🔗"Uncover new opportunities in the world of cryptocurrencies with AhmadArz.
💡Join us on TradingView and expand your investment knowledge with our five years of experience in financial markets."
🚀Please boost and💬 comment to share your thoughts with us!

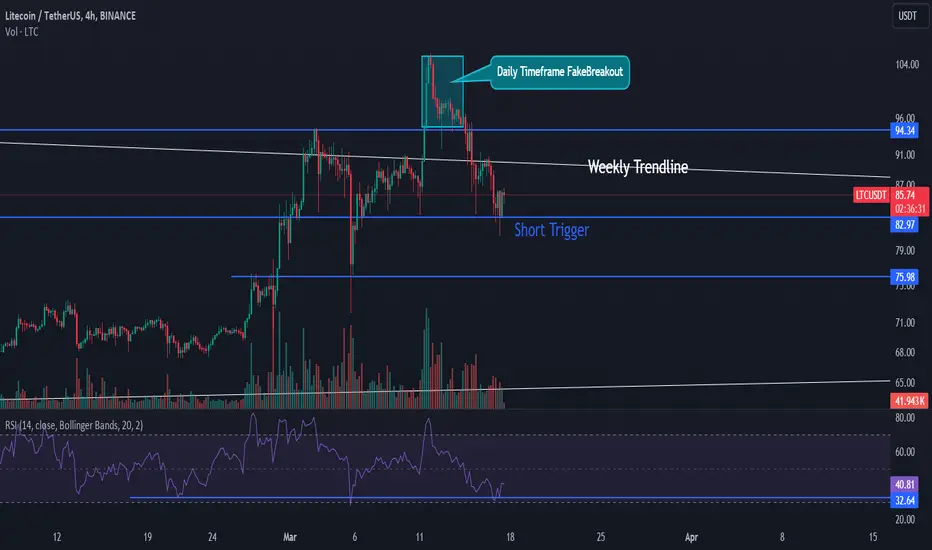
📈LTC Analysis: Short Position Opportunity in Volatile Market🔥🔍Today, we are focusing on analyzing LTC for future prospects. It's worth noting that it's Monday, typically associated with lower market volume and increased market volatility.
🔒On the 4-hour timeframe, we find ourselves within a trading range, with the resistance ceiling at $94.34 and the support floor at $82.97. A recent rejection from the upper boundary suggests that sellers have more strength compared to buyers. Thus, initiating a short position could be a more secure move.
📉In case the $82.97 support level is breached, entering a short position with a target price of $75.98, accompanied by a well-defined stop-loss, could offer a minimum risk-reward ratio of 2.
💎The SMA7 indicator has converged with the price, potentially signaling further downward momentum. If the SMA7 fails to maintain the trend, we'll wait for confirmation from the SMA25. Failure on both indicators may lead to a sideways movement, possibly retesting the upper boundary of the trading range. 📊In the recent downtrend, the volume of red candles has diminished compared to the initial wave. While this could be attributed to the typically lower trading activity on Sundays, a resurgence in volume from tomorrow onwards is essential. Failure to observe increased volume could indicate weakness in the trend.
💥 Additionally, the RSI oscillator provides a critical support level at 32.64. Simultaneous breach of the $82.97 support level and the RSI support could serve as another confirmation for a short position.
❌In conclusion, vigilance is paramount today. If the short position trigger is breached or if setting a large stop-loss to avoid unnecessary risk or setting too small a stop-loss to quickly hit the target, it's crucial to maintain a balanced approach.
🧠💼It's important to acknowledge the inherent risks in futures trading, with the potential for margin calls if risk management is neglected. Always adhere to strict capital management principles and utilize stop-loss orders, ensuring that the initial target offers a risk-to-reward ratio of 2.
LTC: Double bottom reversal coming!The price of LTC has formed a double bottom, and we may soon witness a big breakout to the upside! If you're looking to trade LTC at the moment, here's a quick setup that you might find helpful!
The idea is: Buy when the price breaks above 106$ and take profits at the levels shown in the chart.
Targets:
1. 112$
2. 120$
3. 120$
-------------------------------------------
About our trades:
Our success rate is notably high, with 10 out of 11 posted trade setups achieving at least their first target upon a breakout price breach (The most on TW!). Our TradingView page serves as a testament to this claim, and we invite you to verify it!

LTC after the Pullback can continue to go upLTC after the Pullback can continue to go up
🔵Entry Zone 81.87 - 84.29
🔴SL 74.52
🟢TP1 90.27
🟢TP2 98.88
🟢TP3 107.98
Risk Warning
Trading Forex, CFDs, Crypto, Futures, and Stocks involve a risk of loss. Please consider carefully if such trading is appropriate for you. Past performance is not indicative of future results.
If you liked our ideas, please support us with your likes 👍 and comments.

LTC LONGi did analysis on LTC and i found breakout on chart according to analysis and i prepared entry point, target point and stop loss as shown in the chart
if you interested to buy LTC then you can buy on entry point as shown in chart and sell it 75% on target point as shown in the chart and also put the stop loss as shown in the chart
disclaimer :- do your own analysis before enter in this trade and i am not liable for any of your loss by this trade
#LTC #LTCUSDT #Litecoin


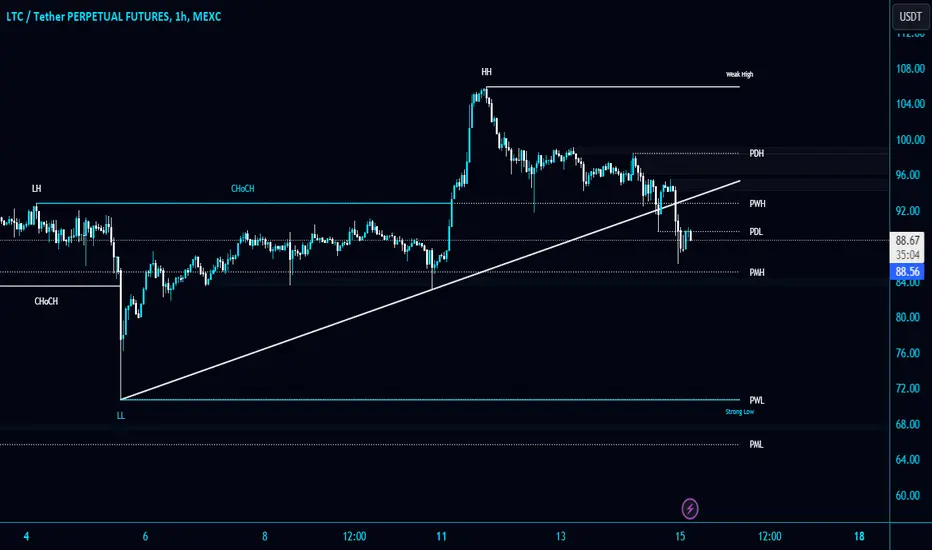
#LTC/USDT breaks the major support level PWH $92.7 and trendline#LTC/USDT breaks the major support level PWH $92.7 and trendline in 1-Hour TF!
CRYPTOCAP:LTC is looking good for a short position. I will wait for a retest to short it. The next local support level is PMH $85.1.
Litecoin looks like a rocket with a delayed launchMost coins and blockchains in 2024 proved their strength after the bearish season. Today, the altseason has arrived for more than 80-85% of crypto assets. Litecoin is next in line for a bullrun.

LTC - BUY SETUP (JAN 2024)LTC - BUY SETUP (JAN 2024)
Using technical analysis, the present configuration of this cryptocurrency indicates an advantageous chance for purchase. Critical indicators point toward promising patterns, hinting at a potentially beneficial entry position. Nevertheless, it's crucial to carefully assess market unpredictability and prioritize risk management before deciding on any investments within the cryptocurrency market.

LTC, the Sleeping Giant now break out!! its ready to takeoff!!Technical Analysis: #LTC (Monthly Update)
#Litecoin now breakout the 238 days accumulation zone, This is just the beginning of new uptrend.
#Litecoin is ready to take off and looks too bullish, it will ready to test its previous high and make new ATH at year-end or earlier.
🥰If you find this helpful and want more FREE forecasts in Tradingview😍.
Please show your support back🙏,
Hit the 👍 LIKE button,
Drop some feedback below in the comment✍️!
❤️🤝 Your Support is very much 🙏 appreciated!❤️🤝
💎 Want me to help you become a better Crypto trader?
Now, It's your turn!
Be sure to leave a comment; let me know how you see this opportunity and forecast.
Trade well, 💪
#LTCCOIN #CRYPTO #BULLISHRUN #ALTCOIN #UPTREND

Litecoin possible ScenarioLitecoin still seems to be in accumulation zone and looking like it want to retrace towards 90-91$ support before going any possibility of going higher.
If bitcoin dumps again ( which I believe will happen ) we can see this as a short term short target for now before tackling the 105$ resistance zone.
I still remain Bullish and I think prices below at current prices is a good long term hold and good entry prices if you believe LTC can hit the ATH again, even if LTC drops further I believe it's just a matter of time before we moon. :)
