LTC 4H SPOTLTC 4H SPOT
.
Market Order Allowed
TP SL On Your Own
LTC is One of Slow Moving Coin
.
CP: 119.XX
LTCBULLUSDT trade ideas

LTC - Loads more up to goI've had a lot of requests for custom analysis on LTC. Its looking strong within the channel and there's potential for lots more up to complete the X wave, which would still look corrective in a very straightforward looking ABC. I actually don't like LTC too much. It's slow, sluggish, doesn't keep up with market trends. But, it's looking strong for some more up. Follow and share for more.

Solana (SOL) Trade Update: Breakout Success and Profit BookingTitle: SOL/USDT Breakout Success | Profit Booked at $260
Description:
This video covers my recent trade on SOL/USDT, where I capitalized on a strong breakout above key resistance levels. After identifying a clear bullish structure supported by volume and momentum, I entered the trade and booked profit at $260. The price aligns well with the 1.618 Fibonacci extension, validating the analysis.
Key Highlights:
Breakout Confirmation:
SOL broke out of the descending triangle pattern with significant volume.
Strong bullish candle closures confirmed the breakout.
Momentum Indicators:
RSI in the overbought region indicates strong upward pressure.
ADX confirmed a strengthening bullish trend.
Profit Booking:
Exited at $260 as price approached key resistance near the Fibonacci target.
Support Levels to Watch:
$226.6 for potential pullbacks and re-entry zones.
Market Context:
Bitcoin's bullish trend further supported the SOL breakout, boosting confidence in the trade.
Conclusion:
This trade demonstrates the power of aligning technical analysis with momentum and volume. Watch the video for detailed insights, including entry, exit, and post-trade analysis. Feel free to share your feedback and ideas!

TradeCityPro | LTCUSDT Potential Approval of ETFs👋 Welcome to TradeCityPro Channel!
Let’s delve into the analysis of LTC, one of the oldest coins in the market. Recently, there have been rumors about its potential inclusion in ETFs, which could attract a good amount of capital and lead to promising movements in the future.
🌐 Overview Bitcoin
Before starting today’s altcoin analysis, let’s look at Bitcoin on the 1-hour timeframe. Since yesterday, Bitcoin experienced a correction, which was necessary for the market, and it pulled back to the 102135 range. The next trigger for a long position will be a breakout above 104714.
Yesterday’s correction, coupled with an increase in Bitcoin dominance, caused noticeable declines in some altcoins. This highlights the importance of monitoring BTC pairs in your checklist these days.
📊 Weekly Timeframe
In the weekly timeframe, Litecoin’s chart reminds me of forex charts because it’s one of the oldest coins that has survived and spent a significant amount of time in a ranging market.
As a reminder, don’t develop emotional attachments to your coins. Don’t assume that any coin is guaranteed to rise. We are here to trade and improve our lives through trading. The chart is what matters. Many coins that were in the top 10 during previous bull runs no longer exist, and Litecoin remains due to its role as a payment coin.
If you entered at the 75.91 breakout trigger, I suggest holding your position for now. It seems like the news of ETF approval is being priced in, but be aware of the risk and continue holding. Breaking the 135.55 trigger will be challenging.
For a new buy entry, the current trigger is the 135.55 breakout. Until the price drops below 47.19, holding is a viable option. Personally, I wouldn’t buy into it, as even the founders of this project seem to have abandoned it.
📈 Daily Timeframe
In the daily timeframe, Litecoin shows an upward trend. After breaking the 74.72 resistance (the top of its daily box), it moved far from it without even a pullback, indicating its relative strength compared to other altcoins.
Following the 74.72 breakout, the price reached the critical weekly resistance of 136.97 and then corrected to 97.91. Drawing a Fibonacci retracement reveals that the 97.91 support aligns with the 0.382 Fibonacci level. A breakout from this level could spark a sharp new upward movement.
Currently, the price is below the critical 136.97 resistance. Buying after a breakout here would be logical and worth the stop-loss risk. Given the recent strong volume, a breakout above 136.97 with a stop-loss at 97.91 is a reasonable entry strategy.
In case of a drop, the price could pull back to the 116.76 level initially and potentially further to 97.91. However, momentum would likely weaken at this point. If 97.91 breaks, deeper corrections could occur, targeting 83.53 and 74.22, though a drop below 97.91 seems unlikely for now.
⏱ 4-Hour Timeframe
In the 4-hour timeframe, after a false breakout below the 97.91 support, Litecoin began a sharp upward movement, shifting its cyclical trend in this timeframe.
📈 Long Position Trigger
I plan to open a futures position after a breakout above 137.99 or earlier if I observe strong momentum. I’ve partially locked in profits from my entry at 104.95.
📉 Short Position Trigger
I won’t consider it as long as the price stays above 115.42 unless the price forms lower highs and lows. Even then, I’d focus on coins still in their daily range boxes rather than those with an upward trend like this one.
📝 Final Thoughts
Stay calm, trade wisely, and let's capture the market's best opportunities!
This analysis reflects our opinions and is not financial advice.
Share your thoughts in the comments, and don’t forget to share this analysis with your friends! ❤️

LTC/USDTKey Level Zone: 122.50 - 125.50
HMT v4.1 detected. The setup looks promising, supported by a previous upward/downward trend with increasing volume and momentum, presenting an excellent reward-to-risk opportunity.
HMT (High Momentum Trending):
HMT is based on trend, momentum, volume, and market structure across multiple timeframes. It highlights setups with strong potential for upward movement and higher rewards.
Whenever I spot a signal for my own trading, I’ll share it. Please note that conducting a comprehensive analysis on a single timeframe chart can be quite challenging and sometimes confusing. I appreciate your understanding of the effort involved.
Important Note :
Role of Key Levels:
- These zones are critical for analyzing price trends. If the key level zone holds, the price may continue trending in the expected direction. However, momentum may increase or decrease based on subsequent patterns.
- Breakouts: If the key level zone breaks, it signals a stop-out. For reversal traders, this presents an opportunity to consider switching direction, as the price often retests these zones, which may act as strong support-turned-resistance (or vice versa).
My Trading Rules
Risk Management
- Maximum risk per trade: 2.5%.
- Leverage: 5x.
Exit Strategy
Profit-Taking:
- Sell at least 70% on the 3rd wave up (LTF Wave 5).
- Typically, sell 50% during a high-volume spike.
- Adjust stop-loss to breakeven once the trade achieves a 1.5:1 reward-to-risk ratio.
- If the market shows signs of losing momentum or divergence, ill will exit at breakeven.
The market is highly dynamic and constantly changing. HMT signals and target profit (TP) levels are based on the current price and movement, but market conditions can shift instantly, so it is crucial to remain adaptable and follow the market's movement.
If you find this signal/analysis meaningful, kindly like and share it.
Thank you for your support~
Sharing this with love!
HMT v2.0:
- Major update to the Momentum indicator
- Reduced false signals from inaccurate momentum detection
- New screener with improved accuracy and fewer signals
HMT v3.0:
- Added liquidity factor to enhance trend continuation
- Improved potential for momentum-based plays
- Increased winning probability by reducing entries during peaks
HMT v3.1:
- Enhanced entry confirmation for improved reward-to-risk ratios
HMT v4.0:
- Incorporated buying and selling pressure in lower timeframes to enhance the probability of trending moves while optimizing entry timing and scaling
HMT v4.1:
- Enhanced take-profit (TP) target by incorporating market structure analysis

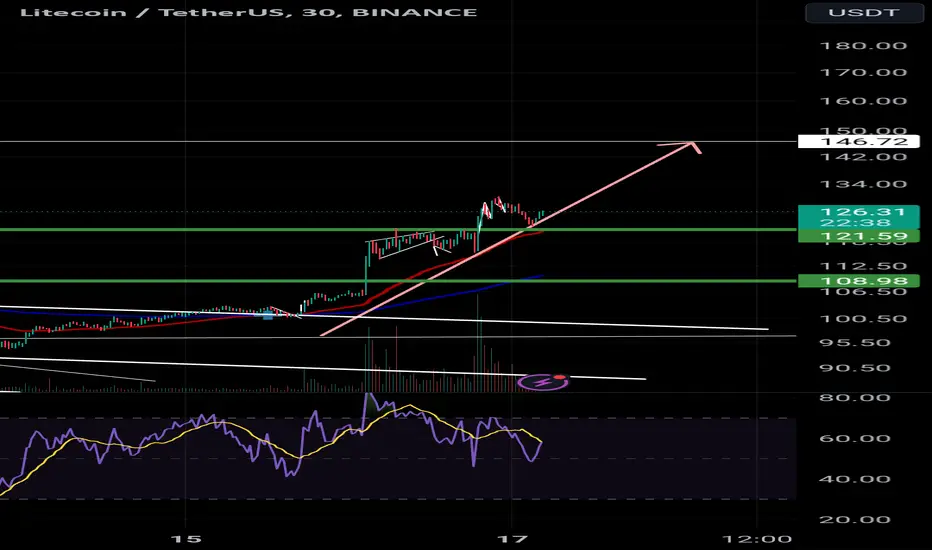
LTC Trade Zones: Short or Long?LTC has been making some moves recently, with a solid rise getting close to a key high. But the current price action hints at an ABC corrective structure, so a pullback could be on the way.
Short Setup:
Entry: Between the 0.618 and 0.786 Fibonacci retracement of the current wave
Stop Loss: $141.4 (the previous high)
Target: $130.7
R:R: About 2:1
Long Setup:
Entry: Around $130, with confirmation
Stop Loss: $126.45
Targets:
First at $134
Second at $147 (the key high)
R:R: A nice 5:1 potential
Why These Levels?
The $130 support zone lines up with the 1:1 Trend-Based Fibonacci Extension ($130.29)
It’s also near a previous swing high, adding more weight to it as a strong level
Plan:
If price moves into the retracement zone, a short trade targeting $130 makes sense
If it hits the $130 support and shows strength, a long setup targeting $134 and $147 could be a great play

Be Lite with LiteCoin - LTC xDI have drawn a smol snake on the chart, That is surely the 7SMA lol, The breaking of that would make the cyan box in place where you can plan next buys for LTC.
I am such a good artist oohhh

LTCUSDT on the Rise: Major Breakout Signal!!MARKETSCOM:LITECOIN ( BINANCE:LTCUSDT ) has broken out of a major resistance level with strong volume, indicating renewed bullish momentum. This breakout marks the start of a potential uptrend, as BINANCE:LTCUSDT shows strength above the critical zone.
If the price holds above this resistance level, we could witness further upside movement, potentially challenging and even surpassing its previous all-time high. With increasing market interest, LTC might just be gearing up for a remarkable rally.
BINANCE:LTCUSDT Currently trading at $130
Buy level: Above $115
Stop loss: Below $85
Target : $410
Max Leverage 3x
Always keep Stop loss
Follow Our Tradingview Account for More Technical Analysis Updates, | Like, Share and Comment Your thoughts

Public trade #12 - #LTC price analysis ( Litecoin )Well, it's been a long time coming, but on January 15, the information began to spread that the SEC “hinted” that CRYPTOCAP:LTC ETFs would be next.
The price of OKX:LTCUSDT reacted to these “rumors” with a fairly good growth
And now let's re-read our idea from 10/16/24 👇
⁉️ If you're lucky, you can still buy #Litecoin at $100
1️⃣ Medium-term goals are $177 and $275
2️⃣ Long-term without changes - $700+
_____________________
Did you like our analysis? Leave a comment, like, and follow to get more

Long idea on $LTCI think the daily altcoin will follow Bitcoin, which will give a good opportunity to take a long from low values, risk 1 to 8

LTC Traders Monitor $123 Support as RSI Signals Waning StrengthBINANCE:LTCUSDT has demonstrated resilience, with recent fluctuations bringing it closer to key support at $136.74. The EMA indicators show a steady upward trend, reflecting short-term bullish momentum. However, as the MACD histogram narrows, traders should watch for a potential consolidation phase. The RSI, recently descending from overbought levels, signals that bullish pressure might be waning, making $123.42 and $117.85 crucial supports to monitor for potential reversals.
For long positions, a bounce from $123.42 with a confirmed bullish MACD crossover could serve as an entry point, while exits near $137.25 or $138.62 would maximize gains. For short trades, a break below $116.54 might offer opportunities, with a downside target near $123.42.

LTC possible playout!LTC / USDT
Chart looks the same like XRP just before the major move in November (broke out major accumulation phase and retested )
This is a possible playout in coming days/weeks
Keep ur eye on it

$LTC Litecoin Weekly partial decline confirmedLitecoin testing the highs of the range again here after a partial decline.
Targets higher would start at the local 1.618 at 219, with resistance at 273, but the measured move would imply a 100% extension which would take up into about 328.
If we were to make new highs here i think youll be looking at 500-700 pretty quick with the 1.618 extension reaching as high as 1500.
I would not be surprised to see LTC included in the American strategic reserve, or ETF's proposed to drive price in this fashion. Youve also got the Proof of Work aspect and its relationship with Doge as a script mineable coin, and the derivatives/futures/Grayscale.
Like XRP and some older coins we've been trading, i think LTC will have its day this cycle, and theres a lot of potential antagonists thatll be ready to explain where the price action came from, but thats typically after the real opportunity has passed.

$LTC on monthly timeframe looks very bullish. Litecoin monthly timeframe is bullish with confirmed buy for flip of 12/21 ema on 1M

Litecoin Joins ETF Race, Boosting Market OptimismLitecoin (LTC), one of the earliest and most established cryptocurrencies, has recently entered the burgeoning race for a spot Bitcoin ETF, mirroring similar efforts in other cryptocurrencies like XRP. This development, coupled with growing community support for Lightchain AI following the rollout of ETF trading features, has ignited renewed interest and bullish sentiment in the Litecoin market. Canary Capital's recent Litecoin ETF filing has sparked a market rally, coinciding with a period of anticipated leadership change at the Securities and Exchange Commission (SEC).1 This article explores these developments, analyzing their potential impact on Litecoin's price and its position within the broader cryptocurrency ecosystem.
Litecoin Joins the ETF Race: A Sign of Maturing Market
The filing for a Litecoin ETF marks a significant step in the cryptocurrency's evolution. Exchange-Traded Funds (ETFs) offer investors a regulated and accessible way to gain exposure to an asset without directly holding it.2 The potential approval of a Litecoin ETF could open the door to a wider range of institutional and retail investors, driving increased demand and liquidity for LTC.
This move mirrors the ongoing efforts to establish a spot Bitcoin ETF and recent developments surrounding XRP. The pursuit of ETFs for various cryptocurrencies reflects a growing acceptance of digital assets within traditional financial markets. It also signals a maturing market, with increasing regulatory scrutiny and the development of more sophisticated investment vehicles.
Canary Capital's Filing and Market Reaction
Canary Capital's filing for a Litecoin ETF has been a catalyst for positive market movement.3 The announcement triggered a noticeable price rally for LTC, demonstrating the market's anticipation of potential ETF approval. This reaction highlights the significant impact that regulatory developments and institutional adoption can have on cryptocurrency valuations.
The timing of Canary Capital's filing is also noteworthy, coinciding with anticipated leadership changes at the SEC. This transition could potentially lead to a shift in regulatory approach towards cryptocurrencies, potentially creating a more favorable environment for ETF approvals.
Lightchain AI and ETF Trading Features: Enhancing Litecoin's Ecosystem
The development and growing community support for Lightchain AI, particularly following the rollout of ETF trading features, further strengthens Litecoin's position. Lightchain AI aims to enhance Litecoin's functionality and scalability, potentially addressing some of the network's limitations.
The integration of ETF trading features within the Litecoin ecosystem provides users with more convenient access to ETF-related products and services. This integration can further drive adoption and usage of Litecoin, particularly among investors interested in participating in the ETF market.
Technical Analysis: Trading Above the 20-Day MA
From a technical analysis perspective, Litecoin trading above its 20-day moving average (MA) is generally considered a positive signal. The 20-day MA is a widely used indicator that tracks the average price of an asset over the past 20 trading days.4 When the price crosses above this average, it can suggest a shift in momentum from bearish to bullish.
This technical indicator, combined with the fundamental developments surrounding ETFs and Lightchain AI, paints a more comprehensive picture of Litecoin's current market position.
Challenges and Considerations
Despite the positive developments, Litecoin still faces challenges. The SEC's stance on cryptocurrency ETFs remains a significant hurdle. The regulatory landscape for digital assets is still evolving, and there is no guarantee that a Litecoin ETF will be approved.
Competition from other cryptocurrencies also poses a challenge. While Litecoin has the advantage of being one of the earliest cryptocurrencies, it faces competition from newer and more innovative projects.5
Long LTC: A Bullish Perspective
The phrase "Long LTC" expresses a bullish sentiment towards Litecoin, suggesting a belief that the cryptocurrency's price will rise in the future. This sentiment is supported by several factors, including the potential for ETF approval, the development of Lightchain AI, and positive technical indicators.
However, it's crucial to remember that investing in cryptocurrencies is inherently risky. Market volatility, regulatory uncertainty, and technological developments can all impact the price of digital assets.
Conclusion
Litecoin's entry into the ETF race, coupled with community support for Lightchain AI and positive technical indicators, has generated significant excitement within the market. Canary Capital's ETF filing and the anticipated SEC leadership change have further fueled this momentum. While challenges remain, the combination of these factors suggests a positive outlook for Litecoin. The potential approval of a Litecoin ETF could mark a turning point for the cryptocurrency, opening it up to a wider audience and solidifying its place within the evolving financial landscape. As always, investors should conduct thorough research and exercise caution when investing in cryptocurrencies.

LTCUSDT: Active Buyers and Key Blue Box Opportunities!LTCUSDT Analysis Active Buyers and Ideal Short-Term Reaction Zones
Buyers are highly active in LTCUSDT, and I’ve identified levels within the blue boxes for potential entries.
Highlights:
Blue Box Levels: Carefully chosen zones where short-term reactions of 10-20% are possible.
Short-Term vs. Long-Term Outlook: While my high time frame expectation leans towards lower levels, these zones are excellent for short-term trades.
Confirmation: Always wait for upward breaks in lower time frames, supported by CDV, volume profile, and other key data points.
Key Observations:
"The blue boxes are very carefully picked using volume footprint, volume profile, cumulative delta volume, and liquidity heatmap. When trading this zone, I will look for buyers and upward market structure breaks in lower time frames for confirmation."
This setup offers an excellent opportunity for short-term traders. As always, stay disciplined and let the data confirm your entries! 🚀
Let me tell you, this is something special. These insights, these setups—they’re not just good; they’re game-changers. I've spent years refining my approach, and the results speak for themselves. People are always asking, "How do you spot these opportunities?" It’s simple: experience, clarity, and a focus on high-probability moves.
Want to know how I use heatmaps, cumulative volume delta, and volume footprint techniques to find demand zones with precision? I’m happy to share—just send me a message. No cost, no catch. I believe in helping people make smarter decisions.
Here are some of my recent analyses. Each one highlights key opportunities:
🚀 RENDERUSDT: Strategic Support Zones at the Blue Boxes +%45 Reaction
🎯 PUNDIXUSDT: Huge Opportunity | 250% Volume Spike - %60 Reaction Sniper Entry
🌐 CryptoMarkets TOTAL2: Support Zone
🚀 GMTUSDT: %35 FAST REJECTION FROM THE RED BOX
🎯 ZENUSDT.P: Patience & Profitability | %230 Reaction from the Sniper Entry
🎯 DEXEUSDT %180 Reaction with %9 Stop
🐶 DOGEUSDT.P: Next Move
🎨 RENDERUSDT.P: Opportunity of the Month
💎 ETHUSDT.P: Where to Retrace
🟢 BNBUSDT.P: Potential Surge
📊 BTC Dominance: Reaction Zone
🌊 WAVESUSDT.P: Demand Zone Potential
🟣 UNIUSDT.P: Long-Term Trade
🔵 XRPUSDT.P: Entry Zones
🔗 LINKUSDT.P: Follow The River
📈 BTCUSDT.P: Two Key Demand Zones
🟩 POLUSDT: Bullish Momentum
🌟 PENDLEUSDT.P: Where Opportunity Meets Precision
🔥 BTCUSDT.P: Liquidation of Highly Leveraged Longs
🌊 SOLUSDT.P: SOL's Dip - Your Opportunity
🐸 1000PEPEUSDT.P: Prime Bounce Zone Unlocked
🚀 ETHUSDT.P: Set to Explode - Don't Miss This Game Changer
🤖 IQUSDT: Smart Plan
⚡️ PONDUSDT: A Trade Not Taken Is Better Than a Losing One
💼 STMXUSDT: 2 Buying Areas
🐢 TURBOUSDT: Buy Zones and Buyer Presence
🌍 ICPUSDT.P: Massive Upside Potential | Check the Trade Update For Seeing Results
🟠 IDEXUSDT: Spot Buy Area | %26 Profit if You Trade with MSB
📌 USUALUSDT: Buyers Are Active + %70 Profit in Total
🌟 FORTHUSDT: Sniper Entry +%26 Reaction
🐳 QKCUSDT: Sniper Entry +%57 Reaction
📊 BTC.D: Retest of Key Area Highly Likely
This list? It’s just a small piece of what I’ve been working on. There’s so much more. Go check my profile, see the results for yourself. My goal is simple: provide value and help you win. If you’ve got questions, I’ve got answers. Let’s get to work!

LTCUSDT UPDATELTCUSDT is a cryptocurrency trading at $118.43. Its target price is $150.00, indicating a potential 25%+ gain. The pattern is a Bullish Pennant, a continuation pattern signaling a potential breakout. This pattern suggests a brief consolidation before a strong upward move. The Bullish Pennant is a positive signal, indicating a potential price surge. Investors are optimistic about LTCUSDT's future performance. The current price may be a buying opportunity. Reaching the target price would result in significant returns. The Bullish Pennant pattern typically leads to a strong upward move. LTCUSDT is poised for a potential breakout and substantial gains.

#LTC/USDT #LTC
The price is moving in a descending channel on the 1-hour frame and is expected to continue upwards
We have a trend to stabilize above the moving average 100 again
We have a descending trend on the RSI indicator that supports the rise by breaking it upwards
We have a support area at the lower limit of the channel at a price of 110
Entry price 112
First target 114
Second target 116
Third target 120

Litecoin 4X Leveraged LONG Trade-Setup (552% Potential)This one here has better timing as the latest shakeout move is already in. Also, LTCUSDT dropped barely in the last two days.
Good afternoon my fellow Cryptocurrency trader, we are already in the pre-bullish breakout phase.
The energy is quiet right now, this is the calm before the bullish storm. A storm with lightning because it will be super fast when it starts to go.
Litecoin produced a strong short-term higher low yesterday compared to the 20-Dec. low. And this opens the door for additional growth.
This is a strong wave I am mapping here. Lev. can be higher but we are using 4X for this set of public trade-numbers. Potential reaches 552% if our last target hit.
You know what they say, "Buy and hold! Patience is key!"
___
LONG LTCUSDT
Leverage: 4X
Entry levels:
1) $105
2) $100
3) $90
Targets:
1) $110
2) $117
3) $124
4) $134
5) $147
6) $167
7) $184
8) $198
9) $223
10) $245
Stop-loss:
Close weekly below $88
Potential profits: 552%
Capital allocation: 4%
____
Thank you for reading and for your continued support.
I can say that in two weeks time half the market will be trading an entire level up and full green.
One month from now, low prices will be a thing of the past but still some time left.
When two months are over, we will be in the middle of the storm, the bullish storm. Massive growth all across the Cryptocurrency market and this growth will extend for many months.
Allow for strong variations. Some pairs will peak early this year while other pairs will peak late.
Your job is to be now in the pairs that will move first, so that you can sell those when they peak and buy those that are still to move. Choose wisely.
Thank you for reading.
Namaste.

Analyzing Litecoin (LTC/USDT): Key Trading Insights with Stop LoIn this article, we’ll analyze the recent price action of Litecoin (LTC/USDT) on the chart. Using a powerful indicator setup, we’ll explore potential trading opportunities and how to utilize stop-loss and take-profit levels effectively. Whether you're a beginner or a seasoned trader, understanding these insights can enhance your strategy.
Support Level: Around $99.91, providing a solid base for potential bullish movement.
Resistance Level: Near $103.36, which could act as a barrier to upward momentum.
Trend: The market currently shows a slight retracement after a bullish move, indicating the need for caution.
Risk Management: Stop Loss and Take Profit
This chart integrates predefined Stop Loss (SL) and Take Profit (TP) levels to minimize risk:
Stop Loss (SL): Positioned below the recent low (e.g., $100.55), ensuring limited downside risk.
Take Profit (TP): Placed near resistance zones (e.g., $103.07) to lock in profits when the price hits the target.
These levels provide traders with a structured risk-reward ratio, optimizing their trades for better results.

Litecoin (LTC): 3 Next Moves That Might Happen We are seeing 3 next moves on Litecoin to be next: Bullish - Bearish - Bullish. Once we get further confirmations here, we might get really good trades out of this coin!
More in-depth info is in the video—enjoy!
Swallow Team

Nobody appreciates it !!!The price will reach the top of triangle = $111 in the short term.
Give me some energy !!
✨We spend hours finding potential opportunities and writing useful ideas, we would be happy if you support us.
Best regards CobraVanguard.💚
_ _ _ _ __ _ _ _ _ _ _ _ _ _ _ _ _ _ _ _ _ _ _ _ _ _ _ _ _ _ _ _
✅Thank you, and for more ideas, hit ❤️Like❤️ and 🌟Follow🌟!
⚠️Things can change...
The markets are always changing and even with all these signals, the market changes tend to be strong and fast!!
