LUMIA Main trend -91% Low/high zones 01/18/2025Logarithm. Time frame 3 days. Fresh cryptocurrency. This main trend of this cryptocurrency itself (the entire history of trades) acts as a secondary trend in meaning.
The legend of the utility-imitation of this cryptocurrency is the tokenization of assets. A very good idea for the future hype of this kind, especially if they will continue to hype the "American" HBAR.
The chart shows the zones (support/resistance horizontal and dynamic) of maximums and minimums for work.
Now, after breaking the logic of the descending wedge (all the price drop), the price went into sideways consolidation. The channel step and local levels are shown. If they draw an inverted head and shoulders with the price in the channel canvas (part is already there), then there will be an exit to % of its base up, just to one of the following designated resistance zones. If the market as a whole is negative, then from this consolidation there may be another wave of decline. The zones are shown in the idea.
The asset itself was dumped after a local listing pump by -91%, these are not the minimum values for assets of such liquidity. But, sometimes if the market as a whole looks bullish, then the trend of the wrapper is reversed, this is an acceptable decline, but not minimal. Consider this in your money management and work tactics.
LUMIAUSDT trade ideas

Lumia & The Altcoins Market —Cryptocurrency & The FedToday LUMIAUSDT is producing an advance, a bullish continuation, after a higher low. This is based on today's full green candle coupled with high volume.
Many other projects are producing strong green candles today, two to three digits green. This is happening while Bitcoin and the top projects trade sideways. What does it mean?
It means that we are bullish—bullish confirmed.
It means that the market will continue growing in the coming days and weeks.
It means that the recent retrace will not be extended nor become strong.
It means that the weak bearish action we saw in the past few days is all the bear action we will get.
It means that whatever happens with the Fed tomorrow, Cryptocurrency will respond in a positive way.
Now, short-term there can be volatility as professional traders take advantage of any and all opportunities to shakeout beginners. Regardless of the outcome of the political event, its effect on the market, volatility at first can be wild.
Continuing, technical analysis is king.
The market is bullish, Bitcoin is bullish and the Altcoins are bullish. This means that the results from the Fed meeting will be something positive for the market. Whatever it is that is interpreted as bullish, that will be the result. Why? Because everything will grow.
The market has been growing since 7-April, an entire month and by late May 2025 everything will be up 200%-300% from its correction bottom and low.
Lumia is not the only example, many pairs are already breaking green today. Since these are smaller than Bitcoin, and the other giants, they can easily move ahead of the pack and that is exactly what is happening.
Thanks a lot for your continued support.
Namaste.

LUMIA is fighting for a bottom signalLUMIA is looking to build a bottom structure. A proper CHOCH at this level would be a good indication that LUMIA is looking for a bullish response. In the meantime, we need to keep in mind that it is a small cap and the volatility is strong. Momentum and trend oscillators are fighting to provide bullish confluence with some signs of bullish divergence.
Full TA: Link in the BIO

LUMIA/USDTKey Level Zone: 0.3080 - 0.3230
HMT v8.1 detected. The setup looks promising, supported by a previous upward/downward trend with increasing volume and momentum, presenting an excellent reward-to-risk opportunity.
HMT (High Momentum Trending):
HMT is based on trend, momentum, volume, and market structure across multiple timeframes. It highlights setups with strong potential for upward movement and higher rewards.
Whenever I spot a signal for my own trading, I’ll share it. Please note that conducting a comprehensive analysis on a single timeframe chart can be quite challenging and sometimes confusing. I appreciate your understanding of the effort involved.
Important Note :
Role of Key Levels:
- These zones are critical for analyzing price trends. If the key level zone holds, the price may continue trending in the expected direction. However, momentum may increase or decrease based on subsequent patterns.
- Breakouts: If the key level zone breaks, it signals a stop-out. For reversal traders, this presents an opportunity to consider switching direction, as the price often retests these zones, which may act as strong support-turned-resistance (or vice versa).
My Trading Rules
Risk Management
- Maximum risk per trade: 2.5%.
- Leverage: 5x.
Exit Strategy
Profit-Taking:
- Sell at least 70% on the 3rd wave up (LTF Wave 5).
- Typically, sell 50% during a high-volume spike.
- Adjust stop-loss to breakeven once the trade achieves a 1.5:1 reward-to-risk ratio.
- If the market shows signs of losing momentum or divergence, ill will exit at breakeven.
The market is highly dynamic and constantly changing. HMT signals and target profit (TP) levels are based on the current price and movement, but market conditions can shift instantly, so it is crucial to remain adaptable and follow the market's movement.
If you find this signal/analysis meaningful, kindly like and share it.
Thank you for your support~
Sharing this with love!
HMT v2.0:
- Major update to the Momentum indicator
- Reduced false signals from inaccurate momentum detection
- New screener with improved accuracy and fewer signals
HMT v3.0:
- Added liquidity factor to enhance trend continuation
- Improved potential for momentum-based plays
- Increased winning probability by reducing entries during peaks
HMT v3.1:
- Enhanced entry confirmation for improved reward-to-risk ratios
HMT v4.0:
- Incorporated buying and selling pressure in lower timeframes to enhance the probability of trending moves while optimizing entry timing and scaling
HMT v4.1:
- Enhanced take-profit (TP) target by incorporating market structure analysis
HMT v5 :
Date: 23/01/2025
- Refined wave analysis for trending conditions
- Incorporated lower timeframe (LTF) momentum to strengthen trend reliability
- Re-aligned and re-balanced entry conditions for improved accuracy
HMT v6 :
Date : 15/02/2025
- Integrated strong accumulation activity into in-depth wave analysis
HMT v7 :
Date : 20/03/2025
- Refined wave analysis along with accumulation and market sentiment
HMT v8 :
Date : 16/04/2025
- Fully restructured strategy logic
HMT v8.1 :
Date : 18/04/2025
- Refined Take Profit (TP) logic to be more conservative for improved win consistency

Lumia Short-Term Full Trade-Numbers (PP: 155%)Next week, when people get back to work from vacations they will have a nice positive surprise coming from the Cryptocurrency market. When they turn on their computers and electronic devices, everything will be green.
Here is a short-term trade setup, the full trade-numbers for LUMIAUSDT.
The chart shows medium and long-term targets, but the numbers below only includes the short-term.
_____
LUMIAUSDT (PP: 155%)
ENTRY: $0.252 - $0.282
CP: $0.278
TP1: $0.294
TP2: $0.338
TP3: $0.373
TP4: $0.408
TP5: $0.459
TP6: $0.523
TP7: $0.594
TP8: $0.708
STOP: Close daily below $0.244
_____
I am wishing you good profits and great luck.
Have fun. The market will be here when you comeback and everything will be up. This is only the beginning though, we are set to experience growth for months to come. Maybe even years.
Namaste.

LUMIAUSDT – Highest Volume Gainer, but Bearish Setup?LUMIAUSDT is showing clear bearish momentum, and I won't be considering longs unless the key red resistance zones are reclaimed. Until that happens, the path of least resistance remains to the downside.
🔎 What’s the Smart Move?
Right now, short opportunities are present, especially if we see low-timeframe breakouts to the downside. The key is waiting for confirmation—I don’t insist on a short idea if market structure flips bullish, but as long as volume supports this decline, I see no reason to fight it.
📌 Key Takeaways:
✅ Red boxes must be regained before I consider bullish scenarios.
✅ Shorting from here makes sense, as long as we get clear LTF breakdowns.
✅ Professional precision is key—this is not a game of guessing but a strategy backed by high-probability setups.
🔹 My high success rate speaks for itself, those who follow my insights know the edge I provide. Stay sharp, and don’t chase weak moves.
📌I keep my charts clean and simple because I believe clarity leads to better decisions.
📌My approach is built on years of experience and a solid track record. I don’t claim to know it all but I’m confident in my ability to spot high-probability setups.
📌If you would like to learn how to use the heatmap, cumulative volume delta and volume footprint techniques that I use below to determine very accurate demand regions, you can send me a private message. I help anyone who wants it completely free of charge.
🔑I have a long list of my proven technique below:
🎯 ZENUSDT.P: Patience & Profitability | %230 Reaction from the Sniper Entry
🐶 DOGEUSDT.P: Next Move
🎨 RENDERUSDT.P: Opportunity of the Month
💎 ETHUSDT.P: Where to Retrace
🟢 BNBUSDT.P: Potential Surge
📊 BTC Dominance: Reaction Zone
🌊 WAVESUSDT.P: Demand Zone Potential
🟣 UNIUSDT.P: Long-Term Trade
🔵 XRPUSDT.P: Entry Zones
🔗 LINKUSDT.P: Follow The River
📈 BTCUSDT.P: Two Key Demand Zones
🟩 POLUSDT: Bullish Momentum
🌟 PENDLEUSDT.P: Where Opportunity Meets Precision
🔥 BTCUSDT.P: Liquidation of Highly Leveraged Longs
🌊 SOLUSDT.P: SOL's Dip - Your Opportunity
🐸 1000PEPEUSDT.P: Prime Bounce Zone Unlocked
🚀 ETHUSDT.P: Set to Explode - Don't Miss This Game Changer
🤖 IQUSDT: Smart Plan
⚡️ PONDUSDT: A Trade Not Taken Is Better Than a Losing One
💼 STMXUSDT: 2 Buying Areas
🐢 TURBOUSDT: Buy Zones and Buyer Presence
🌍 ICPUSDT.P: Massive Upside Potential | Check the Trade Update For Seeing Results
🟠 IDEXUSDT: Spot Buy Area | %26 Profit if You Trade with MSB
📌 USUALUSDT: Buyers Are Active + %70 Profit in Total
🌟 FORTHUSDT: Sniper Entry +%26 Reaction
🐳 QKCUSDT: Sniper Entry +%57 Reaction
📊 BTC.D: Retest of Key Area Highly Likely
📊 XNOUSDT %80 Reaction with a Simple Blue Box!
📊 BELUSDT Amazing %120 Reaction!
I stopped adding to the list because it's kinda tiring to add 5-10 charts in every move but you can check my profile and see that it goes on..

LUMIA/USD 1$1. Price & Moving Averages:
Current price: Around 0.493 USDT
Price is below all EMA lines (20/50/100/200) → still in a long-term downtrend.
Ichimoku Cloud: Price is below the Kumo cloud, and both Tenkan & Kijun are flat → indicating no clear bullish confirmation yet, but potential consolidation phase.
2. RSI (Relative Strength Index):
RSI = 54.71, slightly above the 50 level → shows early bullish momentum.
Not in overbought territory → still room for upward movement.
3. MACD:
MACD Line: 0.012, Signal Line: -0.002, Histogram is positive.
MACD has crossed above the Signal Line → bullish crossover, a positive sign.
The upward slope of MACD suggests momentum is slowly building.
4. WTO (Wave Trend Oscillator):
WTO value is around 70, recently crossed above 60 → stronger bullish signal forming.
However, it's approaching overbought territory, so it should be watched closely for a possible pullback.
5. Volume:
Slight increase in volume recently, showing interest picking up, possibly indicating accumulation before a breakout.
6. Heikin Ashi Candles:
Recent candles have small bodies and long upper wicks, suggesting price stabilization and decreasing sell pressure.
Conclusion:
Short-term bias: mildly bullish. RSI, MACD, and WTO are all turning positive.
Medium-term: still bearish until price breaks above the cloud (Ichimoku) and EMA200.
A break above the resistance zone around 0.55–0.60 USDT could trigger a stronger bullish trend.
Suggested strategy: Consider small entry (scaling in) if bullish momentum continues, and watch for confirmation of breakout from cloud resistance.

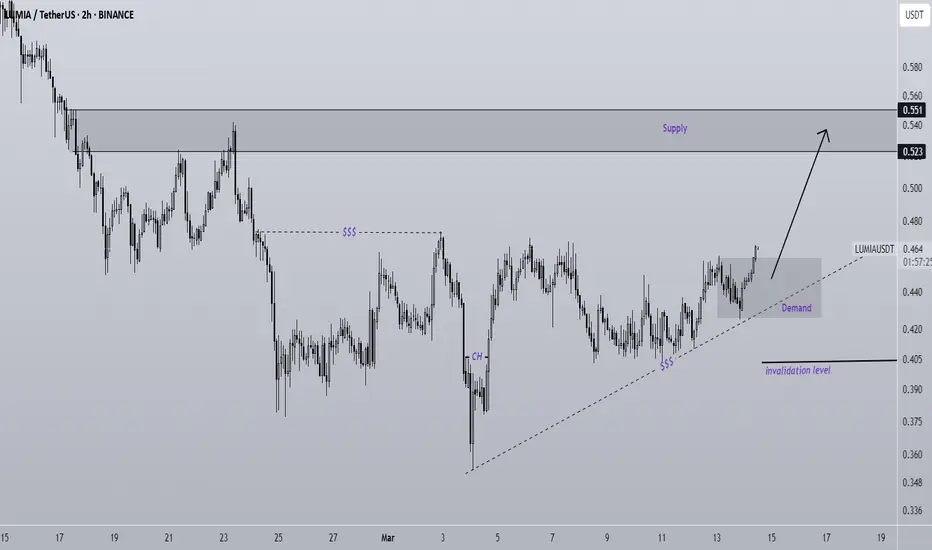
LUMIA Buy/Long Setup (2H)A bullish iCH has formed on the lower timeframes, and there is a liquidity pool above the chart.
The main supply zone is marked on the chart.
We are looking for buy/long positions from the demand zone.
Touching the invalidation level will invalidate this analysis.
Do not enter the position without capital management and stop setting
Comment if you have any questions
thank you
Lumia Breaks ResistanceThe price of Lumia has broken through the resistance level. Simultaneously, a bullish divergence is forming, indicating a potential upward movement. There is a high probability that the price will retrace to the 0.236 Fibonacci level. The risk-reward ratio (RRR) looks very favorable.

LUMIAUSDT 12HLUMIA ~ 12H
#LUMIA If you still have Conviction on the coin,. This support block would be a very good buying place for now.

LUMIA - Will this coin flash the RWA's Market?Lumia is the first next-generation blockchain to provide a comprehensive solution across the entire life cycle of real world assets (RWAs), from asset tokenization, to liquidity aggregation, and connectivity to millions of DeFi and Web3 traders.
This coin has broken the 1,5$ area which was a major barrier for the price, and before that is has create an amazing rounding bottom, ready to explode.
The industry of RWA is great and the momentum is quite optimistic, considering BTC on his highs.
Will this be enough?
We have some targets, for example 2.7$ and 4$, but that can surprise us with more upside potential!
Good trading!

Lumiausdt trade opportunityLUMIAUSDT is currently displaying a rounding bottom formation, a bullish technical pattern that suggests potential upward momentum.
The price has successfully broken above the neckline and retraced to establish solid support in the neckline area. This pullback provides an opportunity to focus on the buy-back zone for long positions. The final target for this setup has been detailed in the accompanying chart.
We welcome your insights on this project, feel free to share your thoughts in the comments. Thank you.

Lumia 4H - V-shape .. Supports Previous TargetsLumia now is forming a V-shape on the 4H time frame. This is extremely bullish pattern that potentially may lead the previous targets $ 3.5 ish.

LUMIAUSDT | Potential Opportunity AheadIn its previous structure, LUMIA exhibited extreme bullish momentum, signaling strength in its trend. Currently, the asset is transitioning into an accumulation phase, which often precedes a significant move. This phase suggests the likelihood of clearing the most recent lows, a common market behavior to sweep liquidity before resuming its upward path.
Based on this observation, the 1.99 level presents a strong potential order zone, aligning with the anticipated sweep. A stop-loss at 1.85 ensures controlled risk while positioning for a favorable risk-to-reward ratio.
Patience and precision are crucial wait for the price to align with these levels before executing your plan. This setup could offer an excellent opportunity to capitalize on LUMIA's next bullish wave.
I keep my charts clean and simple because I believe clarity leads to better decisions.
My approach is built on years of experience and a solid track record. I don’t claim to know it all, but I’m confident in my ability to spot high-probability setups.
My Previous Analysis
🐶 DOGEUSDT.P: Next Move
🎨 RENDERUSDT.P: Opportunity of the Month
💎 ETHUSDT.P: Where to Retrace
🟢 BNBUSDT.P: Potential Surge
📊 BTC Dominance: Reaction Zone
🌊 WAVESUSDT.P: Demand Zone Potential
🟣 UNIUSDT.P: Long-Term Trade
🔵 XRPUSDT.P: Entry Zones
🔗 LINKUSDT.P: Follow The River
📈 BTCUSDT.P: Two Key Demand Zones
🟩 POLUSDT: Bullish Momentum
🌟 PENDLEUSDT: Where Opportunity Meets Precision
🔥 BTCUSDT.P: Liquidation of Highly Leveraged Longs
🌊 SOLUSDT.P: SOL's Dip - Your Opportunity
🐸 1000PEPEUSDT.P: Prime Bounce Zone Unlocked
🚀 ETHUSDT.P: Set to Explode - Don't Miss This Game Changer
🤖 IQUSDT: Smart Plan
⚡️ PONDUSDT: A Trade Not Taken Is Better Than a Losing One
💼 STMXUSDT: 2 Buying Areas


LUMIAUSDT LUMIA/USDT is experiencing a notable surge in volume and buyer interest, signaling growing momentum. If this trend continues, Lumia could present a high-potential opportunity for traders and investors.
Keep an eye on this pair—momentum-driven moves often yield exciting results. As always, manage risk and trade wisely!
I keep my charts clean and simple because I believe clarity leads to better decisions.
My approach is built on years of experience and a solid track record. I don’t claim to know it all, but I’m confident in my ability to spot high-probability setups.
My Previous Analysis
🐶 DOGEUSDT.P: Next Move
🎨 RENDERUSDT.P: Opportunity of the Month
💎 ETHUSDT.P: Where to Retrace
🟢 BNBUSDT.P: Potential Surge
📊 BTC Dominance: Reaction Zone
🌊 WAVESUSDT.P: Demand Zone Potential
🟣 UNIUSDT.P: Long-Term Trade
🔵 XRPUSDT.P: Entry Zones
🔗 LINKUSDT.P: Follow The River
📈 BTCUSDT.P: Two Key Demand Zones
🟩 POLUSDT: Bullish Momentum
🌟 PENDLEUSDT: Where Opportunity Meets Precision
🔥 BTCUSDT.P: Liquidation of Highly Leveraged Longs
🌊 SOLUSDT.P: SOL's Dip - Your Opportunity
🐸 1000PEPEUSDT.P: Prime Bounce Zone Unlocked
🚀 ETHUSDT.P: Set to Explode - Don't Miss This Game Changer
🤖 IQUSDT: Smart Plan

LUMIA - CUP & HANDLE completed, 3$ next
Hello,
We can see a clear CUP & HANDLE pattern formed and completed for Lumia.
We are now ready to head up to 2/3$ in Q1 2025.
NFA
Cheers

Lumia - 2 Patterns heading to 2.6 and 3.4Lumia is forming two patterns:
1) Cup and holder (orange) ==> 2.6
2) Rounded Bottom (black0 ==> 3.4

LUMIA looking bullish broke out and consolidating above . low liq on this coin so dont go balls deep DYOR and take a small risk
sl 1,4
tp 2,25

Trading opportunity for LUMIAUSDTBased on technical factors there is a Buy position in :
📊 LUMIAUSDT
🔵 Buy Now
🪫Stop loss 1.200
🔋Target 1 2.150
🔋Target 2 2.700
🔋Target 3 3.700
💸RISK : 1%
We hope it is profitable for you ❤️
Please support our activity with your likes👍 and comments📝

LUMIA | GOOD FUNDAMENTALSLumia is a good project, I want to get involved somewhere and blue boxes looks nice.
I don't overcomplicate things and add a ton of dirty crap to my charts, but you can check out the success of my analysis below.
I approach trading with confidence backed by experience and past success in identifying high-probability setups.
While I don’t claim to be the best, my track record speaks for itself, and I strive to let my analysis and results do the talking. Watch these levels closely—markets can confirm what charts already whisper. Let’s see how this plays out together.
My Previous Ideas
DOGEUSDT.P | 4 Reward for 1 Risk much more if you hold it.
RENDERUSDT.P | HTF Accuracy
ETHUSDT.P | Accurate Buyer Zone Identification | High Risk Reward if you hold it.
BNBUSDT.P | Accurate Buyer Zone Identification | High Risk Reward if you hold it.
Bitcoin Dominance | Great Characteristic Detection and Accurate Analysis

Consider ORN Price ActionLumia rebranded from ORN and the ORN token is still trading on coinbase with sufficient volume until coinbase plans to list Lumia. Clearly, the two continue to trade based on previous ORN price action.
We should consider that the price of ORN/LUMIA has been forming a falling wedge on the ORN chart, with lows sitting above the outside of a long descending channel. There may be potential for a breakout of this wedge, and with the low market cap of this altcoin, a large amount of volatility may ensue. Recent price action has not been very exciting, but this is to be expected when any token/coin/asset sits in a consolidation phase. However, we should not expect a continued consolidation of this alt coin for too long as there is clearly money flowing into altcoins as BTC aims to reach its new ATH. Whether or not Lumia will join the alt coin pumps is something we will have to wait for and see.
In the case of a bullish breakout, using the fib levels from the previous high could potentially yield a 100% gain. Higher targets could be considered due to ORN's previous ATH in the $35-45 range, but this is not guaranteed.

Lumia / Usdt BINANCE:LUMIAUSDT
The Lumia Price is currently sitting at $1.242 📉, which indicates a slight downward movement. The first key support area to watch is around $1.98 🔻. This level is crucial because if the price fails to reach or hold this area, the market could experience further downward pressure.
If the price doesn't manage to hold at $1.98, the next support zone to look out for is much lower at $0.912 🔽. This level would indicate a significant drop, and traders should keep a close eye on price action near this point for possible signs of stabilization or further decline.
On the flip side, if the price breaks through and successfully holds below the $0.912 level, it could indicate a bearish trend, and the next resistance level could come into play around $1.500 🚀. This resistance level is important to monitor as a potential barrier that may halt any upward movement. If the price manages to push through this resistance, it could signal a potential reversal or upward momentum.
However, keep in mind that this analysis is for informational purposes only and is not financial advice. Always do your own research and consult with a financial professional before making any investment decisions. 🙅♂️📊
