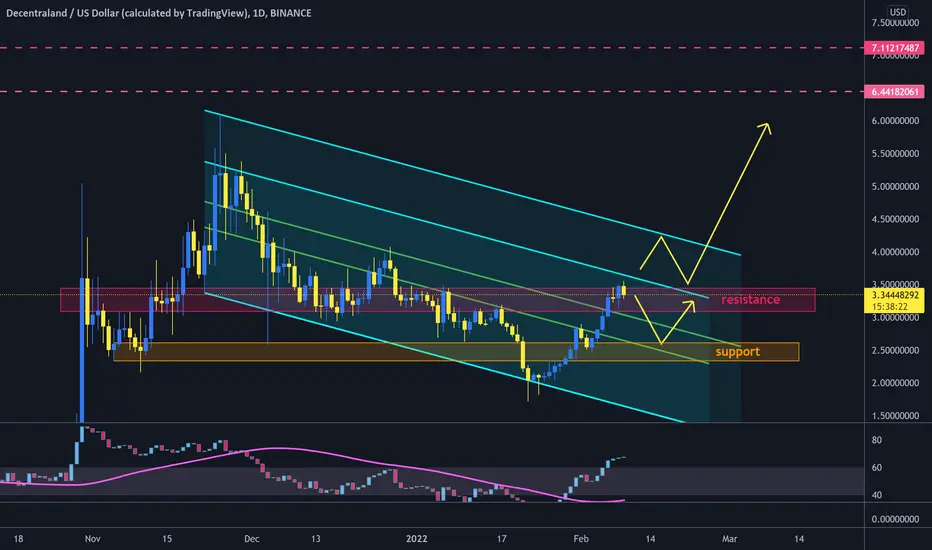
Decentraland MANA 23% drop or 60% pumpHello all. Looking at MANAUSD on the weekly timeframe, we see that this coin has broken bearish out of the (white) falling channel/descending channel.
Currently MANA is inside the green up-trending/ascending channel. On the daily as well as on the weekly mana failed to break above the $3.5 psychological price barrier. Currently mana is due to a retest and here are the scenarios where and why the price can go next.
Bearish scenario: If mana fails to break above $3.5, I would expect mana to retest the bottom of the channel at around $2.5. This is where the daily 200 EMA is currently. From the current price to the bottom of the channel it is a 24% drop.
Bullish scenario: In case mana break above $3.5, I would look for the price to reach first the fibonacci golden pocket at $4.3-$4.5, and then $5.9 the top of the channel. From the current price to the top of the channel it is a 60% up.
The stochastic RSI is very bullish, as it has never been so oversold and with a reading below 20.
Thanks for reading, and stay tuned. Enjoy.
MANAUSD.P trade ideas

MANA Well done!MANA had a great pump.
Expect a little rest and profit taking.
If you are looking to get back in look near or below $3
$3.33 will be difficult to break at this time.
Good Luck

Complete the "W," then...From institutional investors, public sentiment on a given day, the Fed, to even the tweakers, so much beyond fundamental analysis and indicators impacts the direction of price movement.
2 Scenarios:
1. So...let's talk about the tweakers. You know they are dying to sell at $3.4567...and not $4.66 or $4.52 where the metrics indicate. But alas, I think we need a deeper correction for the health of the coin. The sooner the better so we can have more information moving onward and upward. I think it will complete the "W" as the last stand before dropping to mid $3.20s, failing, then continuing down towards the Fib .382 and .5 levels. I can't find it now, but I had a lower number above $2.87, around $2.96, that I was looking at the other day? Maybe it was just the Fib before it went up to $3.55.
2. The "W" is essentially a double bottom, which is bullish. Why not push higher at that point? I don't know...I think the bulls are tired and there have been a lot of shorts and it's just time to go back down. So, if the tweakers fail to break the uptrend, it may hit its $3.60's target. I do think this is possible as BTC looks positioned to hit $45500, perhaps Dbl topping to give the market a point to come back down. In confluence with BTC's trend, MANA is forming a symmetrical triangle with a target of $3.55, another Dbl Top. Fib. retracements won't be affected unless MANA breaks $3.55. This is not financial advice so keep a close eye on things. Good luck.
3. My plan, and definitely not financial advice: Sell with the tweakers...buy back in around $3.38 if I think BTC is still on track...sell at $3.55, then follow Mr. Fib.

MANA / USD 1 hour chart patterns - minimalI have been using this method for almost a decade. I have recently started listing them here for the play function. This is not an offer of anything other than patterns i use to feel the market. I think i am hitting on a similar array used by algorithms and AI. Time will be a part of this so the play function becomes an important aspect of set paths.

Nice short-term buy signal for #Decentraland #MANANice short-term buy signal for Decentraland MANA
Chart also shows the last two comparable signals - of course never a guarantee.
What do you think - do you hold this coin? 😎
Drop me a nice comment if you'd like me to analyze any other cryptocurrency.
*not financial advice
do your own research before investing

MANA LONG PRO TRADE SETUP by baris34H TF 20 EMA tested.
My entry is at 3.15
Take profit at 3.75
If market goes up like this I may trade more and get back posting more setups.
MANA trend lines#MANA/USD
$MANA is inside descending parallel channel, and now struggle inside resistance zone that can be around upper line of the channel.
🐮 if it success to break out descending resistance and parallel trend line from shadow of ATH, it will head up toward $6.5 and $7.
🐻 if price reject from this descending trend line, it will drop to support zone around $2.5.
MANA a start on a quick short here...MANA has been running hot for a few days even prior to the Kings pump and RSI looks like the last cell left on a TSLA battery. Let's see if this starts to give back to the downside. As always you got to watch $BTC as it can pull even the overbought up.

MANA from HeavenDecentraland. Fastest growing Metaverse. Where all NFTs will be interchangable. The concept of composability where everything can be linked. Why would I not invest?

MANA - STRONG MOMENTUM, STAYING ABOVE ITS MAs! What's Next?Happy Money Monday, Traders!
Hope you find value from this post.
If you did, pls like and consider following.
Here's a trading idea.
But firstly...
==============================
Quick Disclaimer:
Trade at your own risk. This post/chart is for your reference only, it is not intended as a recommendation, nor is it an advice to sell nor buy this crypto asset, nor to place any trade. This is only trading opinion.
Trading poses a risk of losing some or all of your money and it will be your responsibility if you lose money.
=============================
MANA continues to trade above its 12, 21 and 50 Moving Averages but as of this time of writing is undecided (currently has a Doji Candle) if it should push further up or retrace.
So, what's happening next?
A. If MANA pushes further upwards, the 50% Fib Level above is the immediate target @ $3.811
B. Retracement from here could bring MANA down to its 50MA which could have a confluence and rendezvous at the 23.6% Fib below @ $2.99 and could also find support from the Green Support Extended Trend Line. The 12MA is also fast rising and could approach price action at the rendezvous.
Just be aware that on the 1HR chart, there's a Bearish Divergence on the MACD against the price action.
Previous resistance and support level was around $2.9
C. MANA could consolidate sideways towards the Green Support Extended Trend Line, then decide whether to push higher or break support.
MACD: Crossed the Zero Level 2-3 days ago, and possibly continue pushing higher but only price action can dictate it
Stoch RSI (1Wk TF): Oversold Region, it just crossed bullish after last week's close.
Price action is KING!
Always remember to place your Stop Loss.
Patience and Discipline are KEYS to a successful trade.
Trading is both a Science and an Art.
Develop an intuition and listen to your instinct while following the rules putting emotions aside.
If you have not yet developed it, you will develop this as long as you stay consistent with following
the rules. The skills will become second nature to you much like how you acquire the skill in riding a bicycle.
Soon it will be your subconscious running your trades, again, much like when riding a bicycle
the balancing is controlled by the subconscious part of your brain.
Be PERSISTENT and stay PERSISTENT.
Let me know what asset you wish for me to look at and evaluate for potential long set ups and I will post it here on TradingView.
If you found value from this post, consider giving it a like and subscribe. Furthermore, share it with someone you know will benefit from this.
More power to all your trades, my friends!
Ron
Intrepid_Trader

Finally, right?I always stress patience, but geez, we've been looking at these numbers...waiting for weeks. Chart is pretty much the same. I'm watching to see if BTC hits $45k, and what it does when it gets there. I anticipate a sell-off to some degree. You can see the ascending ORANGE channel has potentially run its course, giving way to its mother in BLUE. However, MANA may be simply gathering more support to break through this resistance on its way to $3.64. Therefore, I am watching to see what happens (soon) as to whether it will continue correcting or break higher of the small symmetrical triangle. This is where the BLUE circle is. Good luck. This is not financial advice.

Wanna get into MANA?Today is a good opportunity to emphasize FOMO. You didn't miss out. $3.14, $3.22, $3.30, $3.43, and $3.64 were/are all targets for this weekend. BTC is flat (slightly in the red), so the higher end of the targets aren't happening. I watched...I hoped...put in my sell for $3.43...missed it and caught $3.3775 after it bounced from $3.32. This leaves me thinking, hoping for my next entries on the way back down. People who FOMO somehow think prices go in straight lines. They never have and never will. I am watching very closely and will trade this all the way down to, hopefully, $2.92...and maybe even $2.81 if I'm lucky. Again, BTC isn't budging. First, I will be watching to see if MANA breaks above $3.33 in the next hour. If it does, I'm right back in for a short bounce that could be fueled by FOMO as people are waking up on the West Coast. That being said, I really don't think this will happen, but if it does, its target is just above $3.43, completing that previous target. What I do expect are bounces all the way down at the levels indicated by TEAL arrows. The rebounding sell prices will be determined based upon whatever short-term resistances are created on the way down. Some assets like ADA and ETH stick really close to Fib. MANA, stays close, but slightly more volatile...and that's why I trade it. I don't have to get the top 2% on a sell or the bottom 2% on the buy...that middle 12%-30% ensures profits and accumulation...and peace of mind, which is priceless. Be careful. Do your own research because this is not financial advice.

MANA By AcroScopicsWe gotten a very nice pop off the lower channel line and have risen above the last pivot high.
I've drawn in a new set of dividing lines (can serve as support or resistance) where price is currently nudging above the top one.
It is possible that price could hit the upper channel line where price may reverse back into the main channel.
I'm going to move the Fibonacci lines once a new high is in place so we can see what the correction looks like.
Thanks for all the LIKE, FOLLOW and COMMENTS!
Check out our other Posts!

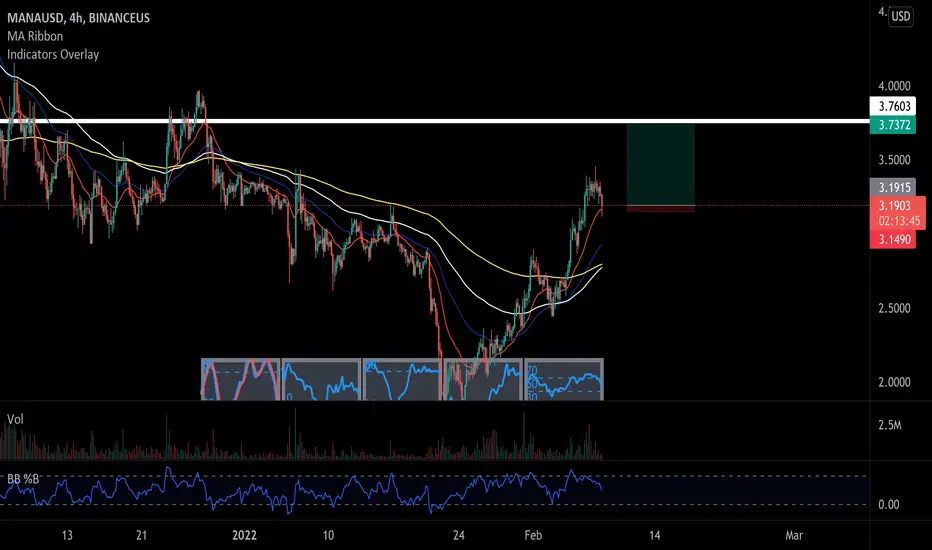
Decentraland (MANA) flipped the MA Ribbon bullish...Decentraland (MANA) flipped the MA Ribbon bullish...
But can MANA break the volume resistance at $3.28?
What do you think? 😎
Drop me a nice comment if you'd like me to analyze any other cryptocurrency.
*not financial advice
do your own research before investing

MANA By AcroScopicsI don't know how to post another version of a chart, so making another post.
This is the MANA chart 4 hour at normal view. Is that a little uptick on RSI??
I zoomed out on the initial one to give you a better overall view.

Bulls on MANA!!!Analyzing the 4 hour chart we expect a slight drop to the lower fib level before we further rise to our next target

$MANA showing some strengthThere will need to be confirmed with a strong close on the daily candle but it MANA is looking very bullish.
It has broken a 2-month downtrend with gusto on good volume (roughly 12 million above the 20 day MA), passed a test of the 50 RSI, and is on the verge of a bullish MACD cross.
With there now being ETF's for the Metaverse and awareness and adoption rapidly increasing, it is a no-brainer that MANA will go up in value as more and more users join the metaverse and increase transactions/advertisements/DAU/time spent in the metaverse.
The technical set-up is really nice too.

Very Good short Opportunity for MANA! Good R/R This is not a financial advice. Just my idea and short term outlook for MANA because of what i can observe on chart.
Rising wedge, Trendline resistance, Resistance Zone.
This is very appealing trade for me and this would work if & if only BTC doesn't surprisingly break above 38k or so which i am not expecting.
Trade safely. Enjoy everyone.

#mana downtrend breakoutlong position.after breaks out its downtrend and pullback its ready to be bullish

$9 AprilMANA is positioned to hit $2.98. Should MANA get through the $3 psych. resistance, it will be set up for a move to $4.15 with a lot of resistance in the $3.50 area. Breaking the trend line around $3.50 opens the gate to an easy path towards $4.15. I anticipate a 15% drop at that time to retest the former resistance before heading up to $5.40. A sharp drop to $4.22 or even the former resistance line (around $3.20 when the time comes), followed by a parabolic shot to $9.23. This is just an idea, as it will have to get there sometime...and not financial advice. MANA needs to break $3.50 first. This bullish theory will be invalidated with a drop below $2.30.

Will the Bulls continue?In the past 24 hours, MANA has broken resistance, converted it to support, and is heading towards $3 after slight resistance at $2.88. Should bulls continue, MANA has a little resistance at $3.14, and significant work to do at $3.23, $3.90, $4.43. Many attribute MANA's initial spike because it "sounded" like Meta when FB changed names. This definitely brought attention to the asset, slid with Meta's recent earnings report but has since broken away into an ascending channel. The C&H pattern will break this short-term ascending channel, finding confluence with the 50MA around $2.98. It looks like BTC should be breaking $38k soon too. This is not financial advice.

It can go down to $0.56It can go down to $0.56.
Be careful. and wait.
It's just coming down from the peak of this cycle.

MANA 35%-56% Rally!If BTC behaves, nothing is stopping MANA from rallying 35% or 56%, depending upon which path it follows. I put the Fib chart up, as I think MANA will face some resistance at $3.31. The C&H has a target of $3.90 (purple). The target from the massive descending wedge is $4.41 (green), 56% above today's high and 73% above the breakout. These targets both line up with the resistance lines (red dot) that I drew back on January 3rd which gives some confluence to these patterns' formation. There may be some typical resistance around $3.50 as well. RSI is 53 on the daily chart, with plenty of room to run. MANA may test support at $2.50, top of the channel it just broke, before heading up? These are just ideas and not financial advice. I'm looking for BTC to break $40k and $42k to be a catalyst for this rally.
