MANAUSDT.P trade ideas


MANAUSDTMANAUSDT(08.20.2022 UPDATED)
Wait until price touches the trend lines then look for signal bar and key bar /Breakout and pullback to recognize direction of price movement.
Money Management must be obeyed.
Open position without setting the proper stop loss (1% or 2% of total balance ) soon or late will cause to lose all your money ( call margin )
Majority of trades is done via computer trading (forex / cryptocurrency)
priority in analyzing charts:
1- Price Action
2- Market structure
3- Chart patterns
4- Candlestick patterns
5-Divergence
6-Indicators

MANA's search for meaningThe MANA 74 Cent level is the strongest support. It is a coin that has spent a lot of time here in the past, then flew away with the metaverse current and came to the same levels again. Level 94 is unfortunately broken. Currently, the 84-74 range seems to be an ideal accumulation area. From this range, preferably close to 74 areas, the risk-reward ratio will be the highest level. The 1.12-1.37-1.68 levels are the biggest resistances in front of them, but after these resistances are broken, the 1.12 resistance is likely to make a quick premium.

MANA/USDTMANA/USDT
It is in a long-term downtrend.
It has broken its internal uptrend line.
It has the possibility of falling to the level of 75 cents.
#MANAUSDT #MANA #BTCUSDT #BTC #ETHUSDT #DOGE #DOGEUSDT
mana Enter 1 : 2.6445
enter 2 : 3.0530
T1: 3.5544
T2: 3.9879
T4: 4.6403
T5: 5.4071
stop: 1 day close under 2.2025

Ascending Triangle Pattern on MANAHello guys today i saw an interesting Ascending Triangle pattern on MANA , it will be a good setup.
wait until break out between 1.0500 and 1.0700 , the open your short position after first candle.
the target is 1.0000 , you can close 50% of your position and risk free that.
remember funda analysis before opening a position.
it's just an idea , always do your research and analysis.
don't forget to follow and boost this idea :) thank you.

MANA long term opportunityChart analysis is simple, it has the potential to simply follow the ascending channel. I don't publish the wave analysis for the sake of clarity but may 22' indicates the end of 2 years cycle. A strong downward breakout invalidate the pattern but chances are low. I think Decentraland (MANA) is a well established crypto project, it has real utility but right now is undervalued. MANA has an established metaverse and far more succesful altcoins are promising a metaverse... I can't see strong reasons to this project falling into oblivion.

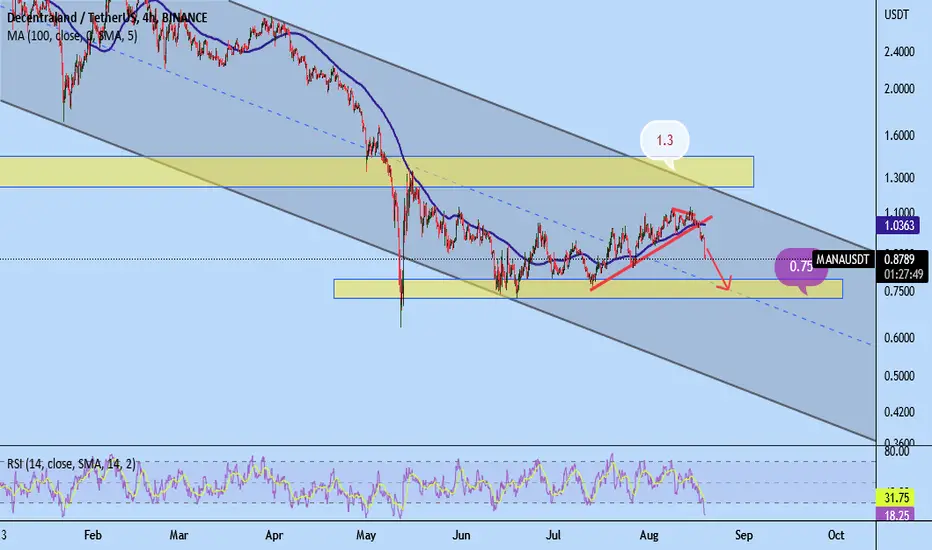
MANAUSDTMANAUSDT(08.14.2022 UPDATED)
Wait until price touches the trend lines then look for signal bar and key bar /Breakout and pullback to recognize direction of price movement.
Money Management must be obeyed.
Open position without setting the proper stop loss (1% or 2% of total balance ) soon or late will cause to lose all your money ( call margin )
Majority of trades is done via computer trading (forex / cryptocurrency)
priority in analyzing charts:
1- Price Action
2- Market structure
3- Chart patterns
4- Candlestick patterns
5-Divergence
6-Indicators

MANA/USDTMANA/USDT
It is in a descending channel.
It has an internal uptrend line that has reacted to it several times.
It is expected that we will increase the price up to the ceiling of the channel and the range of 1.3 dollars.
#MANAUSDT #MANA #BTCUSDT #BTC #ETHUSDT #DOGE #DOGEUSDT

Decentraland MANA Entry Range, Take Profit and Stop LossMANA/USDT
Entry Range: $1.00 - 1.13
Take Profit 1: $1.30
Take Profit 2: $1.52
Take Profit 3: $1.73
Stop Loss: $0.84

MANA/USDT: Bullish reversal tentative - 1,20 to watch---- Mid-term Analysis for the next coming 4 weeks to 3 months - Based on Daily Chart -------
MANA/USDT: Bullish reversal tentative - 1,20 to watch
Context
- The Global Crypto market leads by BTC and ETH reversed a new bullish trend - BTC and NFT/METAVERSE COIN remains in underperformance versus ETH.
- We are watching at 1,20 to bypassed to extend the bullish recovery in progress
Market configuration
- Graphical Elements :
Graphical support = 0,99 & 0,7990
Graphical Resistance = 1,20 & 1,95
- Mathematical Indicators:
EMA ( Exp Moving averages) are support at 0,99 = Bullish
RSI indicator (below) is now above 50% with room to the upside = Bullish
- Elliot & Harmonic Wave (Fibonacci):
A last drop to draw the wave (C) B is now completed - the market is now bouncing off in recovery
Fibonacci resistance of the wave = 1,20
Fibonacci bullish wave target at 1,95
Fibonacci bullish wave support at 0,7980
Fibonacci bearish wave target at 0,5940
Conclusion
Prefered case => As long as 0,7980/0,99 remains support a larger recovery towards 1,20 is expected with strong conviction, only a break above 1,20 will open a direct recovery potential towards 1,95
Alternative case => Breaking 0,7980 a new bearish attack towards 0,5940 will occur

MANA seems bearish for short rangeLiquidity grabbed and a strong supply zone is formed, just waiting mana to enter the zone.
Trade is according to SMC Concepts...

#MANA/USDT - Long - Potential 26.75%CPI report causing a pump in all risk asset markets. Trading View is struggling with the pump so unfortunately I cant show you my set up but it is written out in the text below. Mana is on a pullback and has broken through resistance. volume flowing in and a key part of the meta verse mom which is recieving significant funding from UAE.
#MANA/USDT - Long - Potential 26.75%
Exchanges: Huobi.pro, Binance, KuCoin
Signal Type: Regular (Long)
Entry Targets:
1) 1.05686 - 100.0%
Take-Profit Targets:
1) 1.05686 - 33.333%
2) 1.05686 - 33.333%
3) 1.05686 - 33.333%
Stop Targets:
1) 1.05686 - 100.0%
Trailing Configuration:
Entry: Percentage (0.0%)
Take-Profit: Percentage (1.0%)
Stop: Breakeven -
Trigger: Target (1)

MANA#MANA
- Between a bat and a crab 🦇🦀
- Monthly Demand
#This is my technical opinion and not a recommendation to buy or sell

MANA- Nice Breakout 🍄Market becoming Bullish early this week as you have been informed:
I think this time is ok to FOMO:
US printing money to fight inflation.. take a wild guess what that can do to Bitcoin (🚀🚀🚀🚀).
BTC Technical analysis:
Still in ascending channel . The Top (resistance) is just below 25k . I see 70% chances of breaking over the channel and off to 28k Resistance (our first target as given few weeks ago).
Watch the video and take a look at THIS:
After the Falls we naturally get a lake
I think it ended up being Perfect.
One Love,
The FXPROFESSOR

MANAUSDT 4hr LongBulls Points:
1. HHHL
2. Bullish timecylce yet to complete
3. 100 MA Crosses above 350 MA
4. August is Bullish 2 times
Bears Points:
1. Rejection from Trendline resistance
2. Rejection from Fib Res 1.13
3. RSI Div

MANA watchThis makes a lot of sense to me, I believe this is a coin that whales would be accumulating

#MANAUSDT 6H Chart
Price is still moving up and it is close to tapping into the 30mins supply at $1.11. MACD is bullish, RSI is bought and EMAs are bullish. We should see price reach this supply where we would be looking for confirmation before shorting towards the imbalance at $0.9.

MANA/USDT looking interestingHey Traders!
We are back with MANA coin. Long time we haven't talked about this one huh.... So we have seen for the past weeks 5 different attempts to breakout from that sideways path which we pointed out on our chart. Will bulls go for the sixth try to breakout? well we cant say anything for sure but we think that MANA will probably hold the resistance and go for the $0.081 zone.
But holding the $1 zone would mean going for a bull run!
If you like ideas provided by our team you can show us your support by liking and commenting.
Yours Sincerely,
Swallow Team 🔱
Disclamer:
We are not financial advisors. The content that we share on this website are for educational purposes and are our own personal opinions.

MANA- Market is weak, we need to HedgeMANA is my selected Short for the day.
Close to 1.0860 Resistance it's ideal (to me) for a short position with SL over 1.10
At the same time check my previous posts/ideas for my other set-ups and most importantly look at this:
Mondays are Red🩸 Ends are Weak💤 Yet we Rise✔️
We might as well have patience and yes: the market will most likely continue to rise but not on a straight line.
DYOR and learn how to trade: it does pay out eventually.
One Love,
The FXPROFESSOR

MANA\USDT 📐ASCENDING TRIANGLE📐🇺🇸Hello friends👋.
📈Long: 5-10% of deposit (pending order at $1.0248)
🔴SL:0.9192$
🟢TP: 1.3302$
Another squeeze in the form of an Ascending Triangle, the price broke through the upper border of the triangle and fixed, I expect a retest and then a long!📈

MANAUSDT AB=CDAB=CD
The AB=CD pattern is easy to identify on charts and consists of 2 equivalent price legs. It has specific Fibonacci measurements of each point within its structure, eliminating room for flexible interpretation. The C point must retrace to either a 0.618 or 0.786 and the BC projection is either 1.27 or 1.618. When the BC projection and the AB=CD completion converge closely and define a small area, the chance of a reversal increases.
The first target would be the 382 retracement of AD and the second target the 618 retracement of AD. A common stop level is behind a structure level beyond the D point. Conservative traders may look for additional confirmation before entering a trade, for instance an aligning RSI value or a specific candlestick pointing at a reversal. TradingView has a smart ABCD Pattern drawing tool that allows users to visually identify this pattern on a chart. There are several variations, based on CD being an extension of AB such as the 1.27 AB=CD or the 1.618 AB=CD pattern.
