TradeCityPro | MANAUSDT Fake Breakout Trigger Activated!👋 Welcome to TradeCityPro Channel!
Let’s dive into the analysis of one of the metaverse coins and quickly check the trigger and the action unfolding on its chart together!
🌐 Overview Bitcoin
Before starting the analysis, I want to remind you again that we moved the Bitcoin analysis section from

Decentraland: Success In 2025 & BeyondRemember the linear chart. When the action goes flat and the candles become very small, sometimes almost invisible, it means that the current sideways period is reaching its end.
After a bear market there is a long-term consolidation phase and then the next bull market. The long-term consolidation

Decentraland to Skyrocket 6000% in 2025? Explosive Potential...On the above 4-day chart price action has corrected 96% since November 2021.
A recession is coming, everyone is talking about it… that can only mean one thing, sellers are ready drop the price action the remaining 4% to $0
But what if…. What if price action prints a 6000% upward move instead?
B

The key is whether it can rise after receiving support at 0.2349
Hello, traders.
If you "Follow", you can always get new information quickly.
Please click "Boost" as well.
Have a nice day today.
-------------------------------------
(MANAUSDT 1D chart)
It receives support near 0.2349
1st: 0.2636
2nd: 0.3136
The key is whether it can rise to the 1st and 2nd

MANA at a Crucial Support | Bullish Reversal in Play?Hey traders!
#MANA is currently testing a strong historical support zone and has shown signs of a bullish bounce, holding above key levels. This could be the beginning of a trend reversal if momentum continues.
Technical Highlights:
Strong support holding firm
Bullish wick rejections near suppor

MANA Motive Wave
The gray descending trendline has been broken, in what looks to be a motive wave (green I-V).
I will be looking for green IV corrections, ideally retesting the trendline, for long trades.
On the flipside, there is no RSI divergence on the recent low, so the probability that we have seen a bottom

MANAUSDT Huge Bounce Incoming?MANA is currently testing a long-term descending support trendline on the weekly chart. This level has acted as a reliable bounce zone multiple times in the past (highlighted with arrows).
-Price is holding above a major support level (~$0.21), showing signs of demand.
-Weekly RSI is forming a bul

I'm Bullish, but... MANA / USDTHi friends,
My latest post about MANA was bullish, and I did buy some of the blood we just had.
But this would be another coin that could drop 25% - 30% giving a great opportunity.
Keep an eye on BTC cause if it dumps, this will happen.
Trade thirsty!

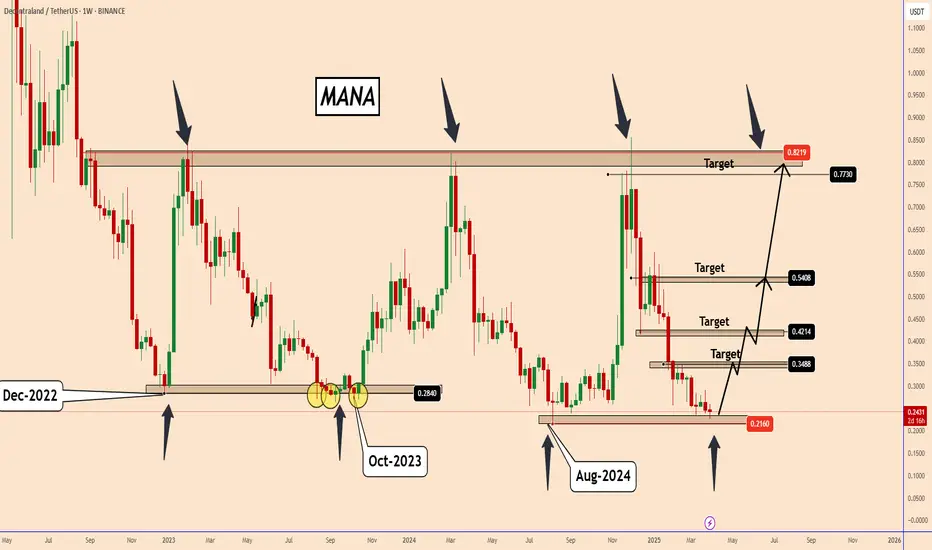
MANA - Observation: Will History Repeat Itself?MANA - Observation: Will History Repeat Itself?
Analyzing the weekly chart of MANA, we can see that the price has reacted sharply around key levels.
Since December 2022, MANA has been moving within a broad trading range, fluctuating between 0.2200 and 0.8200.
Looking at past price movements, MAN
RR=4 buy ideaPotential reversal scenario : bullish shark pattern + breakout of falling wedge + Bullish RSI divergence , price might reverse and retest previous swing highs
PS : never risk more than 2% of your capital per trade

See all ideas
Displays a symbol's price movements over previous years to identify recurring trends.
Related pairs
Frequently Asked Questions
Decentraland / Tether (MANA) reached its highest price on Nov 25, 2021 — it amounted to 5.8999999 USDT. Find more insights on the MANA price chart.
See the list of crypto gainers and choose what best fits your strategy.
See the list of crypto gainers and choose what best fits your strategy.
Decentraland / Tether (MANA) reached the lowest price of 0.0022200 USDT on Sep 19, 2017. View more Decentraland / Tether dynamics on the price chart.
See the list of crypto losers to find unexpected opportunities.
See the list of crypto losers to find unexpected opportunities.
The safest choice when buying MANA is to go to a well-known crypto exchange. Some of the popular names are Binance, Coinbase, Kraken. But you'll have to find a reliable broker and create an account first. You can trade MANA right from TradingView charts — just choose a broker and connect to your account.
You can discuss Decentraland / Tether (MANA) with other users in our public chats, Minds or in the comments to Ideas.