MANA short term short play opening nowMana has crossed down 50 DEMA and approaching 200 DEMA down. Bearish confirmation almost complete on candles. Opening 3xs @4.91.
MANA3S/USDT 2021-11-29 04:44:59 Buy 0.169 USDT 3381.33 MANA3S 571.44477000 USDT 3381.33 MANA3S 0.169 USDT Filled
MANAWBNB_728912.USD trade ideas

Bull flag formation In the 4 hour chart we can see a bull flag forming. Price action found consolidation zone between 4.47-4.95 before breaking above 5.00. Looking to blast upwards again going to see a dump again around 6.00 mark at least and hopefully consolidate above 5.50ish price.
THIS IS NOT FINANCIAL ADVICE. MY PERSONAL GUESSTIMATE. GOOD LUCK EVERYONE AND THANK YOU.


MANAUSDStop if this pivot breaks. First target $6, to sell half, then trail with the **DAILY 10/20sma’s
bing bong, give me a kiss
Ayyyoooo!!!

MANA NEW HIGH 6$ +130%As you may know, all the highs created by cryptos that have not yet been reached will be broken, giving us new historical highs.
In the specific case of MANA, I would look for a new high to form three upward moves.

Mana usdtMana usdt final accumulation. There after we see good pump and dump. Then market will decide which direction to price will go. I will update soon 🤓

MANAUSD (1H) Bullish reversalHi Traders
MANAUSD (1H Timeframe)
Waiting for the upward break of 4.96 resistance level, which will complete a bullish trend reversal pattern to go LONG. Only the downward break of 4.27 would cancel the bullish scenario.
Trade details
Entry: 4.96
Stop loss: 4.27
Take profit 1: 5.36
Take profit 2: 6.02
Score: 7
Strategy: Bullish reversal

A whole view from the last uptrend(may be the last for 2021)Impulsive and correction waves projected before have worked pretty well (Elliot wave principle-possible targets zones)
The timeframe shall not be taken as a reference.
This idea is not financial advice.

MANAUSD BUY IDEADMana has pulled back into the GOLDEN zone areas of 50%-71% fib support levels. If we hold these strong levels of support/floor, we could potentially see our next push up to test previous highs of $5.50 again to the 161.8 fib resistance of $7. Currently price is at $4.90 which is a great buy in price. Targets are set from fib levels resistance zones. First potential target is the 100% fib level, Second potential target is the 127 fib level and finally Target to 161.8 fib level. But I would take profit accordingly as price rise hitting the different profit targets. This is not financial advice and I'm not a financial advisor, please do your own due diligence this is only my opinion.

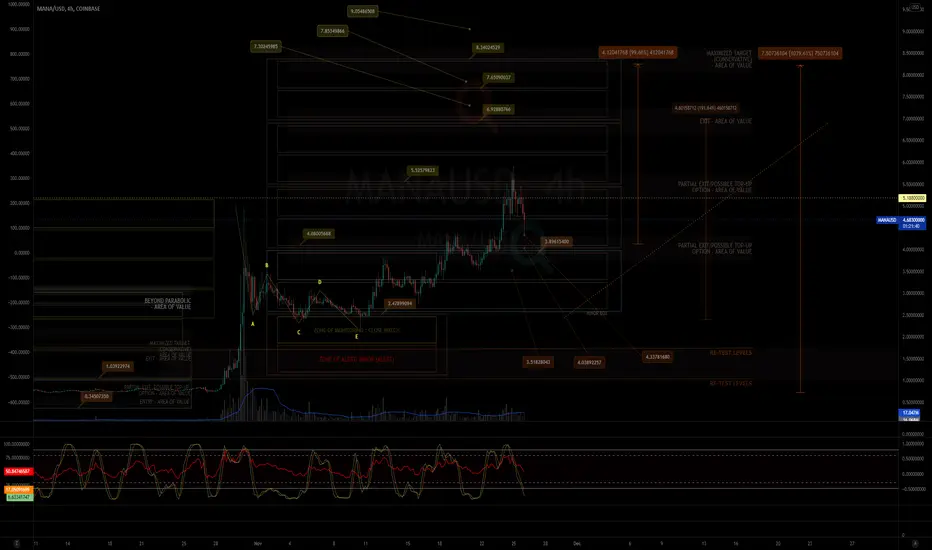
MY MINIMALIST CHART ANALYSIS FOR DECENTRALAND$MANA
11.26.21
1829H +8 SINGAPORE
ALERT:
LOOKING FOR BEST TOP-UP ENTRY BEFORE the end of the SWING CYCLE.
We are now looking at an ENTRY that we can TOP-UP for our Investment FIB 0.618 or LOWER.
A little more till we finish this swing and move to the next swing cycle.
VITAL SIGNS : RSI, STOCH are all looking good. We will just wait for oversold. While the VOLUME shows SUPPLY building up for DEMAND (FUD).
The Market has amazingly moved along the TOPS and BOTTOMS of our BOXES, signifying TURNING POINTS of PRICE ACTION. Volatility for this market is healthy.
and we have gone a long way from the bottom of the SWING.
Happy Trading!
Disclaimer:
The findings of the following analysis are the sole opinions of the publisher of this idea and should not be taken as a piece of investment advice.
INSTRUCTIONS: HOW TO USE THIS MINIMALIST CHART
"FOLLOW THE WHITE RABBIT!"
Just Follow the TOPS and BOTTOMS of the BOXES as a GUIDE where the MARKET will take you.
Created on a MONTHLY, WEEKLY & DAILY Analysis of a MARKET'S CHARACTER.
It is designed for SWING TRADES at the BOTTOM. I do not SHORT, though, you can still use it.
TARGET ZONE IDENTIFICATION
The LARGE BOXES (Tops and Bottoms) are MAJOR turning points that will occur sometime in the future. While the SMALL BOXES (Tops and Bottoms) are MINOR turning points.
These can be entries to a BUY/ SELL POSITION, EXIT/PARTIAL EXIT/TOP-UP AREAS, as well as Support and resistance levels
Also includes MAXIMUM TARGET EXIT AREA OF VALUE - CONSERVATIVE (If price action conditions are right at that given moment.)
At times I include WAY BEYOND PARABOLIC Price TARGETS depending on The Character of the Market (CRYPTOS ONLY).
DYOR for your Volume, Chart Patterns, Candlestick Math, FIB COILS ( ABC ), Price Action, FIB LEVELS, Market Dynamics, especially institutional and retailer trading psychology.
Wishing you all The Best Trades and Thank you all for your Appreciation and Support of My Work.
Much thanks to My 3 Mentors. They are so much of a Blessing that I also wish to Share.
Vive Le Autist!
Vive Le Egalitarianism!
MANA Heading further Down!Haven't really been looking at any charts for while but looking a little bit more into cryptocurrency lately! Mana heading down to 4.40 and should be maybe looking to getting into buys once into this zone! BTC and ETH having some rough days lately but we make $$$ up or down lol. Will update on how this aged.

Mid Term MANAUSDStrong Bullish candle on on daily support and
between the 10 and 20 day MA. Breakout on the
lower time frames. Plan is to scale in continuously
where i can and move SL behind each retrace.
long term Target is 7.106

MANA is ready to advanceMANA found support on the fib at $4.35 and tested the edge of the triangle.
Those were the areas to add back more MANA.
IF BTC is done dumping, MANA should continue up to $6.60 and $8 as next targets for profits.
Good Luck


$MANA will we see $7.00+ by YE 2021?Helllooo WORLD!
$MANA, is channeling along a bullish pennant, will we see $7.00+ before YE and will the most maximized entry be in the low $3's within the next 2 weeks? Feel free to share your thoughts below!
Much Love,
MS ROBOT
COINBASE:MANAUSD

MANA $7 incoming very soon Hello all. Here is a quick and simple MANA analysis. Like the entire market, mana took a dive today towards the Fibonacci golden retracement pocket around $4.3. This level is also the support level if we look at the daily chart.
Looking at MANA price action on the 4 hours, we can see that MANA broke down bearish after the head and shoulders pattern played out. We had two retests around the golden pocket and also it Looks like we have found support at the 50 EMA .
The stochastic rsi remains in the oversold territory but I expect the price to go as low as $4 but not further.
The long entry at this price level will get us 65% profit once the price of MANA reaches $7 (fib 161% and top of channel). I see this just another opportunity to buy at cheaper prices.
Thanks for reading, share and comment. Enjoy.

Mana - iH&S neckline backtestAfter falling bear out of the wedge pattern a iH&S formed and confirmed. Volume had an uptick on the right shoulder ascension.

That's what might be the expected scenarioEW principles have shown to be correct in the last ideas I posted.
Now it seems we might still have some room for correction. However, It shall be reassessed for every relevant leg (up or down).
This is no financial advice. Time frames are not assessed nor forecasted.
Happy Thanksgiving day!!!
"I consider patience to be the most important ingredient for success in the market." Francois Rochon

MANA - Triangle in 3DSetting 30 minute Higher Lows as price recovers from the confirmed H&S pattern. Setting up a wedge under neckline resistance


MANA Take ProfitsGreat run for MANA, hit target. If you a scalping take profits. if you are long, hang on.
I am watching to DCA between $4.35 and $3.58
Good Luck

A Chart on Support and Resistance on an Uptrend This is an uptrend trend considering the fact that there has been no break out of the higher lows from the last support.

