MATIC COIN I have been waiting for a chance to buy for a long time and now with the price reaching the bottom of my channel, it seems like a good time to buy to reach a new price.
MATICBULLUSD trade ideas

Analysis and signal of MATIC CurrencyHad been successful in the uptrend and reached the resistance
I expect to go back to the unused ardler block
That is the price of 0.57
And then start the upward trend
Our Staplas is 0.64 and 0.63
Has a relatively high risk

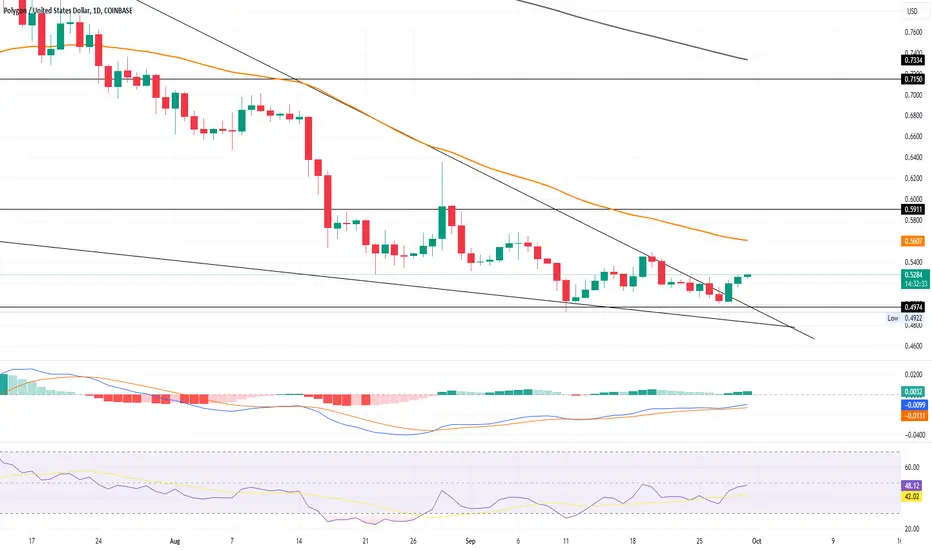
MATICUSD Double bullish break-out.Polygon (MATICUSD) closed yesterday above the 1D MA100 (green trend-line) for the first time in 6 months. At the same time it broke above the top (Lower Highs trend-line) of the Falling Wedge pattern since February 18. The 1D RSI was already on a Higher Lows Bullish Divergence since Augst 22 so this is a technical bullish break-out for the long-term. Our target is the 1D MA200 (orange trend-line) at 0.7000.
-------------------------------------------------------------------------------
** Please LIKE 👍, FOLLOW ✅, SHARE 🙌 and COMMENT ✍ if you enjoy this idea! Also share your ideas and charts in the comments section below! This is best way to keep it relevant, support us, keep the content here free and allow the idea to reach as many people as possible. **
-------------------------------------------------------------------------------
💸💸💸💸💸💸
👇 👇 👇 👇 👇 👇

MATIC/POLYGON - long position |AnalysisHello Traders, here is the full analysis.
Watch strong action at the current levels for BUY. GOOD LUCK! Great BUY opportunity MATICUSD
I still did my best and this is the most likely count for me at the moment.
Support the idea with like and follow my profile TO SEE MORE.
Traders, if you liked this idea or if you have your own opinion about it, write in the comments. I will be glad 🤝
Patience is the If You Have Any Question, Feel Free To Ask 🤗
Just follow chart with idea and analysis and when you are ready come in THE GROVE | VIP GROUP, earn more and safe, wait for the signal at the right moment and make money with us💰

How will the matic work?It is in a support box
A positive rsi divergence is observed
I expect this support to be pulled towards the block order
Block order is located in our target
Vastaplus provides 4-hour support

MATIC No Fear Through Breakdown. A Must W@tchnot financial advice.
Breakdown of Matic and where we are going near term and potential moves into the future.
Like,Comment and Follow

Will MATIC price Surpass $0.65?Price Jump: MATIC price action shows a 3.63% increase, hinting at a bullish reversal.
Double Bottom: The price action suggests a double bottom reversal from the $0.50 level.
50-day EMA: A breakout above this level could propel MATIC to $0.65.
Market Recovery: A market-wide bullish trend is benefiting MATIC, placing it among the top gainers.
Uptober Spirits: The bullish sentiment for October could push MATIC towards $1 in 2023.
Resistance at $0.60: MATIC faces strong resistance at this level, failing to break the 50-day EMA.
Technical Reversal: An overnight jump of 3.71% keeps the price above $0.50.
Technical Indicators: MACD shows a potential positive crossover, while the 50-day EMA acts as dynamic resistance.
Current Price: MATIC is trading at $0.5304, with an intraday movement of -0.69%.
Optimistic Scenario: A breakout above the 50-day EMA could lead to a price of $0.65.
Pessimistic Scenario: A reversal from $0.60 could send MATIC back to $0.50.
Entry Point: The next crucial entry point for traders would be a breakout above the 50-day EMA.

✴️ Polygon (MATIC) | Yes & No!Yes, I am eternally bullish not because I am biased but because it is the right time to be bullish.
No, the signals are not in yet but this pair will also turn.
No, Polygon is not bullish but will turn bullish soon enough...
➖ Here we have a clear and strong V shaped bottom in June 2022.
➖ We have a developing Adam & Eve bottom in June-October 2023.
➖ Trading volume has been dropping since November 2021.
➖ We have a very strong long-term higher low.
➖ Now new lows vs an extended consolidation as the market transitions from bearish to recovery (sideways), from sideways to bullish...
👉 Since we are transitioning to bullish and we have confirmation from all across, we can say Yes, Polygon will also go up.
Namaste.

MATIC.USD (SHORT-TERM)Hello friends.
How are you today?
It's the second analysis that I publish today.
Many users asked me to talk about Matic for Short-Term
So I decided to talk about that briefly.
I use Gann Fan and Ichimoko and the time frame is Weekly.
According to the data, the price still respects the Gann Fan's line. It looks nice.
Also, I use ichimoko too.
Based on Ichimoku the price is below the Tenken-sen and Kijun-sen, the future cloud is still bearish and the Chiko span is below the Candles.we had a negative swsitch between tenkensen and Kijunsen. It means we are still in a bearish trend. and the time shows us about 2-3 weeks later, the price will touch the purple line (1/3)
Also, the price action tells us the first support zone could rescue the price against more drops. As a result, I expect that the price will drop to 0.42 USD first and if this support zone could not prevent more dropping, we should see the price in the second support zone.
But in the long-term, I expect more dropping, minimum to second support zone.
So, we have to be patient and see what will happen…
Please don’t forget to write your comments ✍️✍️ Like 👍👍 and Share 👌👌 this Vision with your friends.
Have a good day
Ho3ein.mnD

MATIC Suffers As 50 EMA Triggers Sell-Off!Bearish Engulfing: MATIC forms a bearish engulfing candle in the daily chart.
50-day EMA Struggle: MATIC fails to reclaim the 50-day EMA.
5.65% Drop: MATIC price drops by 5.65%, warning of further downside.
Psychological Mark: MATIC may test the $0.50 psychological mark soon.
Recent Breakout: MATIC had a recent breakout but faced a bearish setback.
Current Price: MATIC is trading at $0.5306, with an intraday move of 0.25%.
Double Top Pattern: MATIC forms a double top pattern at the 50-day EMA.
RSI Indicator: Daily RSI line maintains a positive trend, hinting at a bullish divergence.
EMA Outlook: 50-day and 200-day EMAs act as catalysts for bearish reversal.
Sideways Trend: MATIC teases a sideways trend between $0.49 and $0.60.
Uptober Rally: MATIC's recent price action threatens the spirit of the Uptober rally.
Positive Reversal: A reversal from $0.50 could rechallenge the $0.60 resistance zone.

MATIC - Elliott Wave Overview ✅Here we have the 2week chart of MATIC. We can see that we're in a clear bullish motive wave.
We are currently in wave 4 which appears to be a complex ABC wave.
We are looking for subwave c move higher to complete wave B.
Trade Idea:
- Entry on red trendline break
- stops below the lows once trendline breaks
- Targets: 1, 1.4, taper
Goodluck and as always, trade safe!

probably head and shoulders 4 hours on MaticI believe it will brake the neck in 4 hours, you will have to be like spider and wait for the entrance

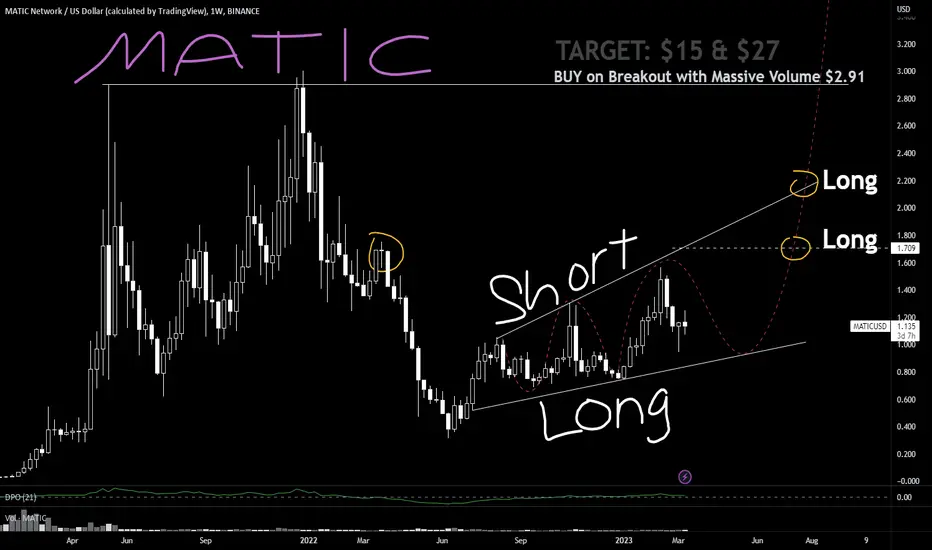
MATiC: Long Short PLAYBOOK
Indians love to churn businesses
so do projects with EXCELLENT marketing
as evident in MATiC price action anchored to series of camaigns
from Name Change POLYGON to recent zkEVM March rollout
Gang of 8 Whales control the Price
and looks like it loves to hunt stops in between the cost of HANDLER
Asian Market handler in control
Euro Market free for all organic market decides
US new york .. handler decides on news event driven anchored to BTC and DXY
Body Clock of Handler is it hunts liquidity at obvious floor ceiling beyond it
notice the TRUMPET formation
size you entry and Churn Milk this with the King of Japipur
NOTE:
do not use Logarithmic scale as it fools or tricks your eyes
stick to normal chart
that harami circled doji in Yello is an indecision or unfinished business of TRADE
to be revisited
MATIC - long positionMy fellow traders, MATIC chart is telling we can get a nice long position. Currently the price action is looking bullish. We can see a clear bullish divergence formed on 3D chart which lead to a break out of trend line. If we break a trend line to the upside I am looking to long Matic on retest. In case price breaks down I am looking to start building a spot position.
Targets and stop loss is indicated in chart.
Good luck.

MATICUSD This Double Bottom can finally break the WedgePolygon / MATICUSD is rallying off a Double Bottom but still remains inside a giant Falling Wedge pattern.
Double Bottoms are generally how big rallies start and this may be no different. Especially since the 1day RSI is on a Bullish Divergence.
This can break the Falling Wedge to the upside. Buy only after the break out and target the Fibonacci 2.0 level at 0.81000.
Follow us, like the idea and leave a comment below!!

Will MATIC Price Reach The 200-day EMA?MATIC displays a bullish reversal with a falling wedge breakout.
The price faces resistance at the 50-day EMA and $0.5911.
A 25% price hike is expected, aiming for $0.71 close to the 200-day EMA.
Google Cloud's staking of 10,000 MATIC boosts positive sentiment.
Long-term correction in 2023 seems to be ending with a bullish momentum.
Crucial bullish support found at $0.49.
Double bottom reversal pattern observed.
Consecutive bullish candles for four days, accounting for a 13% jump.
Current trading price is $0.5618 with an intraday fall of 1.13%.
MACD line spikes higher, indicating bullish momentum.
RSI nearing the overbought boundary, signaling bullish strength.
Failure to sustain above the 50-day EMA could lead to a price retest at $0.52 or $0.50.

MATIC Price Analysis: MATIC Breaks Trendline, Hints 30% Hike!MATIC price action shows a potential bullish reversal.
The 50-day EMA has been a major resistance, keeping bullish growth in check.
A trendline breakout could unleash a new bullish rally.
MATIC has been in a long-term downtrend, leading to a death cross.
Recent support found at $0.49, teasing a potential reversal.
The price is currently trading at $0.52, with a 5.23% jump in the last two days.
A double bottom pattern is forming, signaling a potential trend reversal.
A morning star pattern has also formed, adding to bullish indicators.
MACD and signal lines avoid a bearish crossover, indicating bullish momentum.
RSI struggles to break above the halfway mark but remains above the 14-day SMA.
Upcoming resistance levels are at $0.59 and $0.71.
Failure to sustain the uptrend could see the price drop to $0.42.
MATIC - Buy AreasIf you are not buying magic now at 0.5 I dont know when you plan to start. Two shaded areas are buy levels for Matic, this project will not die.

Solid Buyers At $0.50 Eyes A Jump To $0.75!MATIC price action shows a falling channel pattern.
50-day EMA is keeping bullish growth in check.
Trendline breakout could unleash a new bullish rally.
MATIC has lost 67% of its value in the last 8 months.
Strong support found at the psychological mark of $0.50.
MATIC is under extreme bearish pressure.
Strong demand at $0.50 is challenging the trendline.
MATIC is trading at $0.5203 with a 1.15% growth in the last 24 hours.
MACD and signal lines avoid a negative crossover.
RSI maintains above the 14-day SMA but struggles to rise.
Bullish divergence is seen in the daily-RSI.
A breakout could push MATIC to $0.74, while a slide under $0.50 could lead to $0.40.

MATIC Breakin Support Target Area'sBreakin 200MA around $1 could lead to the bottom of wedge $0,8 and a Support 0f $0,75.
Breakin the up stated Support areas and the next drop lead to the Wedge Target around $0,4 $0,30 (also Fibonacci Target's)

Bearish ContinuationDear Trader,
I trust you're doing alright.
MATICUSD has broken out of the rectangle range. The current bias is bearish as the most recent price action is a break below the resistance level. We thus expect the price to continue downwards.
On the other hand, if the price should trade above the trendline resistance and break the current static resistance level, this would change our bias to bullish.
Dear trader, what is your thought on MATICUSD?
Kindly like and comment below.


Bearish ContinuationDear Trader,
I trust you're doing alright.
MATICUSD is currently trading within a rectangle range. The current bias is bearish as the most recent price action is a break below the resistance level. We thus expect the price to continue downwards.
On the other hand, if the price should trade above the trendline resistance and break the current static resistance level, this would change our bias to bullish.
Dear trader, what is your thought on MATICUSD?
Kindly like and comment below.
