MATIC headed down to 1.20's?
I believe we will see some bears win for awhile until the better news of hiring or a next project comes out.
MATICBULLUSD trade ideas

MATIC/USD 1DAY UPDATE BY CRYPTO SANDERSHello, welcome to this MATIC/USDT 1DAY chart update by CRYPTO SANDERS.
I have tried to bring the best possible outcome to this chart.
CHART ANALYSIS:-Polygon (MATIC) was one of last week’s big movers, however, it has now fallen for a fourth straight session.
MATIC/USD dropped to a bottom at $1.41 on Tuesday, less than a day after the price was trading at $1.50.
On Saturday, polygon bulls pushed prices deep into the overbought territory by leading the token to its strongest point since last April.
As a result of this overbuying, bears saw this as an opportunity to reenter the market, sending the RSI from a high of 75.10 to a current reading of 62.70.
The index is now hovering marginally above a floor at 62.00, and should this be broken, bears could attempt to extend recent declines.
This is not a piece of financial advice.
Hit the like button if you like it and share your charts in the comments section.
Thank you

MATIC Alt Coin - AccumulatingLooking for a pullback to get into this run. Polygon is the best blockchain in Web3 gaming and support many other DAPPS. It's been pumping and did not crash like many other Alt Coins did in the last downtrend. Disclosure... our project CroozeNFT.io web3 game is built on the Polygon Blockchain.

100% up from here?It is possible that we will see a strong rise to the area specified above for the completion of wave C, and then another decline begins


MATIC - Road to 2024MATIC showed so much strength during this bear market.
There is always a downside when it comes to DCAing so the risk is obvious.
This is going to be a long accumulation year so keep the bags small.
I have been very patient with MATIC so imo it’s time to jump in with SMALL BAGS.
Winter is long; bags will get heavier.

📉💸 According to my analysis, #MATIC is likely to trend downwar📉💸 According to my analysis, #MATIC is likely to trend downwards in the near future. #cryptocurrency #trading 🔍💻💰

Matic $1.60 follow uplook at previous post, Almost there, DogElonMars just pumped 23%, just need a bit more for the inverted head and shoulders target of $1.60!
pull back after and or consolidate

Matic TK Cross Matic is attempting a TK Cross above the cloud on the 4hr chart. If this pattern completes you better bet your house on it. The Daily chart also looks good, let’s see what happens.

MATIC UPDATE #PolygonPolygon (formerly Matic Network) is a Layer 2 scaling solution backed by Binance and Coinbase. The project seeks to stimulate mass adoption of cryptocurrencies by resolving the problems of scalability on many blockchains

MATICUSD Tests Crucial Lines Ahead of a Possible Trend ReversalMATICUSD shows a major trend reversal signal according the Heikin Ashi hourly chart. This becomes with testing the support of the crucial lines of Fibonacci 23.6% at 1.2818 and 1.2770, as this area has a very important volume profile. Also, it is near the SMA-100, which is in turn, a very important for trend signaling as the orange shaded area below it demonstrates.
A breakdown below 1.2818 and SMA-100 may confirm the trend reversal of MATICUSD. The area between 1.2555-1.2396 levels is the bearish target for MATICUSD if the breakdown would happen. If a further breakdown below those bearish levels occurred, the area between 1.2168-1.2055 would be the next bearish target as well.
On the other hand, if MATICUSD managed to stabilize above the area of 1.2818-1.2770, this may invalidate the previous bearish hypothesis and the area between 1.2899-1.2933 may be retested again in order for MATICUSD to continue its bullish trend toward 1.3231-1.3307 as the next possible targets.

Short term polygon analysis Here is a short term bullish idea based on areas of support and resistance

MATIC - WyckoffWe are facing MATIC making the pattern Wyckoff at phase UTAD. After that the price will slowly go down until lost the box and test new supports more lowers.

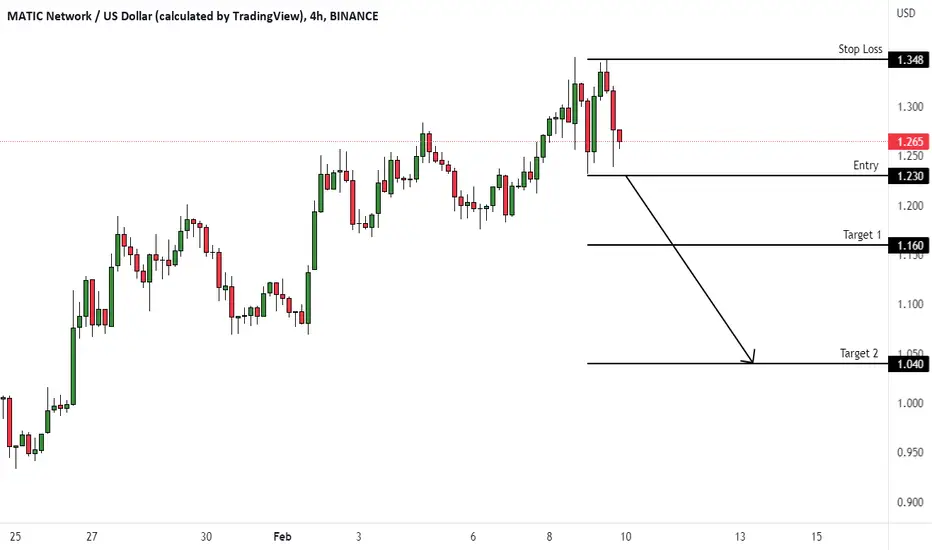
MATICUSD (4H) - Bearish reversalHi Traders
MATICUSD (4H Timeframe)
Waiting for the downward break of 1.230 support level which will complete a bearish trend reversal pattern to go SHORT. Only the upward break of 1.348 would cancel the bearish scenario.
Trade details
Entry: 1.230
Stop loss: 1.348
Take profit 1: 1.160
Take profit 2: 1.040
Score: 5
Strategy: Bearish reversal
$MATIC cup/handle?Could this be a cup/handle forming for $MATIC? Strong moves over the past couple weeks


Matic updateWhat Is Polygon (MATIC)?
Polygon (previously Matic Network) is the first well-structured, easy-to-use platform for Ethereum scaling and infrastructure development. Its core component is Polygon SDK, a modular, flexible framework that supports building multiple types of applications.


Trippy! MATIC Head & Shoulders 5 DAY INVERTED CHART!We've been in a bear trend for a while, so we are used to looking at down-trends. So..look at MATIC Polygon in the 5 Day time frame, huge Head and shoulders forming, and if this chart plays out, remember it's INVERTED target is $1.60 the common FIB 0.5 retracement of actually increase.
Really Trippy buy if you understand it Matic could have enough steam, but HOT already, Only one or 2 more 5 day periods left before a big marklet cool off, shows in BTC also.
REMEMBER INVERTED CHART

$MATIC about to break major resistance$MATIC is looking like it wants to break a major resistance level. I do believe it will be one of those coins that will surprise investors this year.
NFA / DYR

Polygon MATIC leaving the penny crypto area after last Fakeout⁉️MATIC leaving the penny crypto area after last Fakeout⁉️
Like in Stock Market the $1 mark is important for cryptocurrencies as well
Just see Polygon price reaction on the chart
Let me know your thoughts in the comments🤗
⬇️⬇️⬇️
Likes and Follow for updates appreciated🤗
Disclaimer:
Not financial advice
Do your own research before investing
The content shared is for educational purposes only and is my personal opinion

Thanks for all the trades $MATIC! Was great last few monthsI like $MATIC, A LOT
It should keep pumping BUT we moved the funds elsewhere
Wasn't done today. This was done close to $1 about a week ago, posted elsewhere
While #MATICUSDT has done well, 10%, the money has performed better elsewhere
You were great old friend, the best during the bear and last few months but looking for more BETA
#metaverse #crypto #NFT

MATICUSD Out of its scalp range, turned bullish.MATIC broke over the scalping range that dates back to July 18th. The only time it broke over it since then was on November 4th and it made a top at 1.310. As long as the price is over the range, 1.310 is our bullish target.
Follow us, like the idea and leave a comment below!!
