MDXUSDT(Mdex) Daily tf Range Updated till 13-07-24MDXUSDT(Mdex) Daily timeframe range. a massive retrace from its new low. and its on monitoring state so the move was pretty expected. made a nice profit there. now local retrace point is at 0.06693. if it can defend it, it may try again at 0.07982.
MDXUSDT trade ideas

MDXUSDTWe can attempt to buy MDXUSDT from specified level as it making HL , also 0.618 FIB level intact indicate that it moves upward.
SL , TP mention in chart.

MDEX (MDX)On the above daily chart price action has corrected 70%. A number of reasons now exist to be long, including:
1) You know why..
2) Multiple oscillators print positive divergence over an extended time frame. Look left.
3) RSI resistance breakouts on both USD and BTC pairs.
4) The last time those conditions printed a significant move followed in the days ahead.
Is it possible price action falls further? Sure.
Is it probable? no.
Ww
Type: trade
Risk: <=6%
Timeframe: Now, don’t hang around.
Return: 250%

#MXD/USDT#MXD
The price moves in an inverted head and shoulders pattern
The right shoulder is now complete
Wall is expected for the upper border of the shoulder
We have a higher stability moving average of 100
We have bullish momentum on the RSI and an uptrend
We have a current breakout of the channel to the upside
Entry price is 0.2500
The first target is 0.3000
The second target is 0.3500
The third goal is 0.4000

Big MDX Green Candle Is CookingHere is an opinion about MDX token and its 10x+ move in the near future bull run. All Defi tokens will rise because of RWAs.

MDEX UpdateMDX is still under the examination of binance ,however just like other coins in this situation
(monitoring) MDEX has a change to recover to the next targets or even more.
For sure it can also pump !
Depending on your risk strategy-allocation ;
MDEX can be a good DEX to invest or trade

A Spring Or Final Test Of Supply Before Markup? Bulls Load Up.BINANCE:MDXUSDT has corrected a whopping 98% from its highs.
It has not followed BTC's bullish rally and currently lingers near a strong demand zone.
If we are to follow Wykoff's Accumulation Schematics, we could be entering Phase C.
Phase A began with Prelim Support / Selling Climax before a 320% Auto Reaction.
This strong rally pushed our resistance zone higher than I would've liked.
Multiple STs then occurred after the SC that ended Phase A.
Phase B also had multiple STs, however price never reached the AR resistance levels.
A "Spring" typically makes a brief dip below the TR support zone, however, this wasn't to be as the bulls stepped in at 5.5 cents, the same low made during the Phase B ST (Secondary test).
We can expect a Test after a Spring (final shakeout/Bear Trap) or a Last Point of Support without the breakdown.
You could even argue that the Spring has already occurred and this is a Test of remaining supply.
Anything is possible.
Test—Large operators always test the market for supply throughout a TR (e.g., STs and springs) and at key points during a price advance.
If considerable supply emerges on a test, the market is often not ready to be marked up.
Several reasons exist to be bullish which include-
8 Oscillators recently printed divergence with a bullish hammer to kick off proceedings.
RSI continues to make Higher Lows and Higher Highs.
Huge Volume Profile appears near the Trading Range lows which quickly diminishes going up.
10D/Weekly Stochastic bullish cross up near oversold levels.
Price currently rests above weekly 10/21 day SMA's while nearing a first-ever cross.
On the 2day, the 50 + 200 SMA's inch closer to a first-ever Golden Cross.
The Bulls have shown great determination to hold the 5.5-cent - 6-cent support zone.
Could the price plummet further? Sure. Having a strategy is key.
The bears need a strong volume-supported break with a prolonged period below support to invalidate this idea.
A strong sell-off in the market could also put pressure on the bulls.
What is Phase C?
It is in Phase C that the stock price goes through a decisive test of the remaining supply, allowing the “smart money” operators to ascertain whether the stock is ready to be marked up. A Spring is a price move below the support level of the TR (established in Phases A and B) that quickly reverses and moves back into the TR.
It is an example of a bear trap because the drop below support appears to signal the resumption of the downtrend.
In reality, though, this marks the beginning of a new uptrend, trapping the late sellers (bears). In Wyckoff's method, a successful test of supply represented by a spring (or a shakeout) provides a high-probability trading opportunity.
A low-volume spring (or a low-volume test of a shakeout) indicates that the stock is likely to be ready to move up, so this is a good time to initiate at least a partial long position.
What Is Mdex(MDX)?
Mdex is an automatic market-making decentralized exchange based on the concept of fund pools. Mdex proposes and implements a dual-chain DEX model based on the Heco Chain and Ethereum. Mdex combines the advantages of the low transaction fees of the Heco chain and the prosperity of the Ethereum ecosystem. With MDEX, users can also participate in dual mining mechanism of liquidity mining and trade mining.
Mdex is committed to building the largest DeFi platform integrating DEX, IMO, and DAO on the Heco and Ethereum.
Current Market Cap - 70m. Circulation Supply - 950.25M
Speculative Setup, DYOR + DD.
Good Luck!

MDX/USDT - Mdex: Trend Reversal◳◱ On the $MDX/ CRYPTOCAP:USDT chart, the Trend Reversal pattern suggests indications that the trend may be gaining or losing strength. Traders might observe resistance around 0.072 | 0.0749 | 0.082 and support near 0.0649 | 0.0607 | 0.0536. Entering trades at 0.0731 could be strategic, aiming for the next resistance level.
◰◲ General info :
▣ Name: Mdex
▣ Rank: 596
▣ Exchanges: Binance, Huobipro, Gateio, Mexc, Hitbtc
▣ Category/Sector: Financial - Decentralized Exchanges
▣ Overview: None
◰◲ Technical Metrics :
▣ Mrkt Price: 0.0731 ₮
▣ 24HVol: 1,712,451.331 ₮
▣ 24H Chng: 8.136%
▣ 7-Days Chng: 19.39%
▣ 1-Month Chng: 29.32%
▣ 3-Months Chng: 15.24%
◲◰ Pivot Points - Levels :
◥ Resistance: 0.072 | 0.0749 | 0.082
◢ Support: 0.0649 | 0.0607 | 0.0536
◱◳ Indicators recommendation :
▣ Oscillators: NEUTRAL
▣ Moving Averages: STRONG_BUY
◰◲ Technical Indicators Summary : STRONG_BUY
◲◰ Sharpe Ratios :
▣ Last 30D: 1.58
▣ Last 90D: 0.49
▣ Last 1-Y: -0.32
▣ Last 3-Y: -0.31
◲◰ Volatility :
▣ Last 30D: 0.62
▣ Last 90D: 1.63
▣ Last 1-Y: 1.08
▣ Last 3-Y: 1.08
◳◰ Market Sentiment Index :
▣ News sentiment score is N/A
▣ Twitter sentiment score is 0.51 - Bullish
▣ Reddit sentiment score is N/A
▣ In-depth MDXUSDT technical analysis on Tradingview TA page
▣ What do you think of this analysis? Share your insights and let's discuss in the comments below. Your like, follow and support would be greatly appreciated!
◲ Disclaimer
Please note that the information and publications provided are for informational purposes only and should not be construed as financial, investment, trading, or any other type of advice or recommendation. We encourage you to conduct your own research and consult with a qualified professional before making any financial decisions. The use of the information provided is solely at your own risk.
▣ Welcome to the home of charting big: TradingView
Benefit from a ton of financial analysis features, instruments and data. Have a look around, and if you do choose to go with an upgraded plan, you'll get up to $30.
Discover it here - affiliate link -


MDXUSDT"As we enter the bullish season, the initial target to aim for is
target : 1.0 🎯.
This is based on a combination of technical analysis indicators and market trends.
However, it's important to approach trading with caution and adapt to changing market
conditions.
Keep an eye on key support and resistance levels, as well as any significant news or events that may impact the market.
Remember to use proper risk management techniques and consider setting profit targets along the way.
Happy trading!"

MDX/USDT - Mdex: Super Trend◳◱ On the $MDX/ CRYPTOCAP:USDT chart, the Super Trend pattern suggests indications that the trend may be gaining or losing strength. Traders might observe resistance around 0.0701 | 0.0745 | 0.0832 and support near 0.0614 | 0.0571 | 0.0484. Entering trades at 0.0672 could be strategic, aiming for the next resistance level.
◰◲ General info :
▣ Name: Mdex
▣ Rank: 418
▣ Exchanges: Binance, Huobipro, Gateio, Mexc, Hitbtc
▣ Category/Sector: Financial - Decentralized Exchanges
▣ Overview: None
◰◲ Technical Metrics :
▣ Mrkt Price: 0.0672 ₮
▣ 24HVol: 824,213.998 ₮
▣ 24H Chng: 1.205%
▣ 7-Days Chng: 52.49%
▣ 1-Month Chng: 53.65%
▣ 3-Months Chng: 1.75%
◲◰ Pivot Points - Levels :
◥ Resistance: 0.0701 | 0.0745 | 0.0832
◢ Support: 0.0614 | 0.0571 | 0.0484
◱◳ Indicators recommendation :
▣ Oscillators: NEUTRAL
▣ Moving Averages: STRONG_BUY
◰◲ Technical Indicators Summary : BUY
◲◰ Sharpe Ratios :
▣ Last 30D: -3.46
▣ Last 90D: 1.77
▣ Last 1-Y: 0.86
▣ Last 3-Y: 0.86
◲◰ Volatility :
▣ Last 30D: 1.72
▣ Last 90D: 3.79
▣ Last 1-Y: 3.00
▣ Last 3-Y: 3.00
◳◰ Market Sentiment Index :
▣ News sentiment score is N/A
▣ Twitter sentiment score is 0.51 - Bullish
▣ Reddit sentiment score is N/A
▣ In-depth MDXUSDT technical analysis on Tradingview TA page
▣ What do you think of this analysis? Share your insights and let's discuss in the comments below. Your like, follow and support would be greatly appreciated!
◲ Disclaimer
Please note that the information and publications provided are for informational purposes only and should not be construed as financial, investment, trading, or any other type of advice or recommendation. We encourage you to conduct your own research and consult with a qualified professional before making any financial decisions. The use of the information provided is solely at your own risk.
▣ Welcome to the home of charting big: TradingView
Benefit from a ton of financial analysis features, instruments and data. Have a look around, and if you do choose to go with an upgraded plan, you'll get up to $30.
Discover it here - affiliate link -

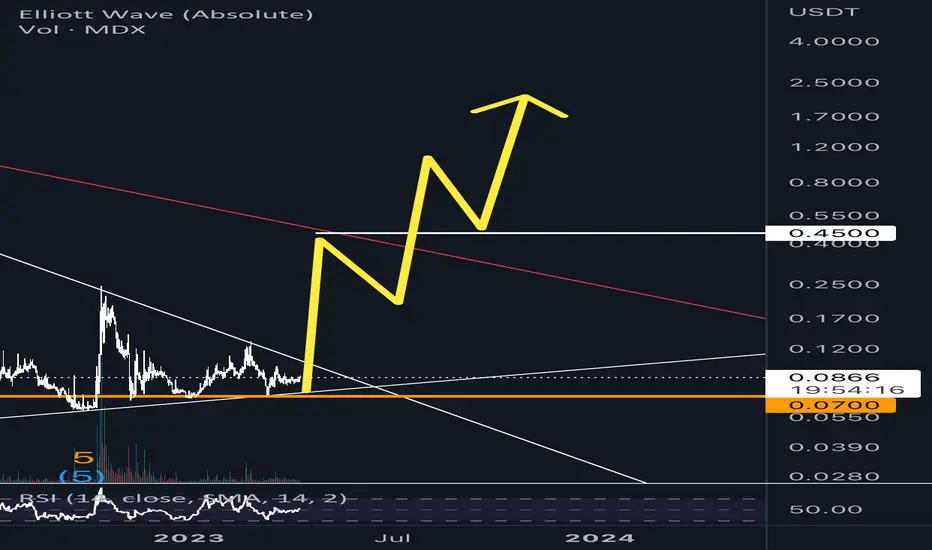
MDXUSDT Trading OpportunityIn September 2022, MDXUSDT reached a significant bottom after a potential 5-wave leg. Since then, the price has been trying to rally back up. We expect a correction pattern (ABC) to follow, with the final target pointing towards our major supply zone.
Keep an eye on immediate supply and demand zones and consider accumulation within the immediate demand zone and towards important support levels.
Set stop-loss orders to be below the important support zone to protect your positions. Aim for the major supply zone as the final target, but remain vigilant for any signs of trend reversal or weakness in bullish momentum.
As with any trading strategy, ensure proper risk management by using stop-loss orders and only risking a small percentage of your trading capital on each trade.

MDXUSDT buyHi my friends
This is my analysis and thinking about this chart and I hope it gives you a trading idea
Follow me and give me a comment so that I can share more analysis for you

MDXUSDT isnexy CYBER- Ready for228% mega PumpMDXUSDT is ready for 228% pump so, if you missed CYBER & NMR Pump Domt miss MDX
It's a very good opportunity to multiply your money.
#NFA

Mdx is Bearish #Mdx is in Big falling wedge at daily time frame and it will keep dumping.
At 4hrs timeframe, Red descending triangle breakdowns but a retest is pending. Might be possible price goes up to red line to retest triangle and then it will go down. Also it can go down without a retest.

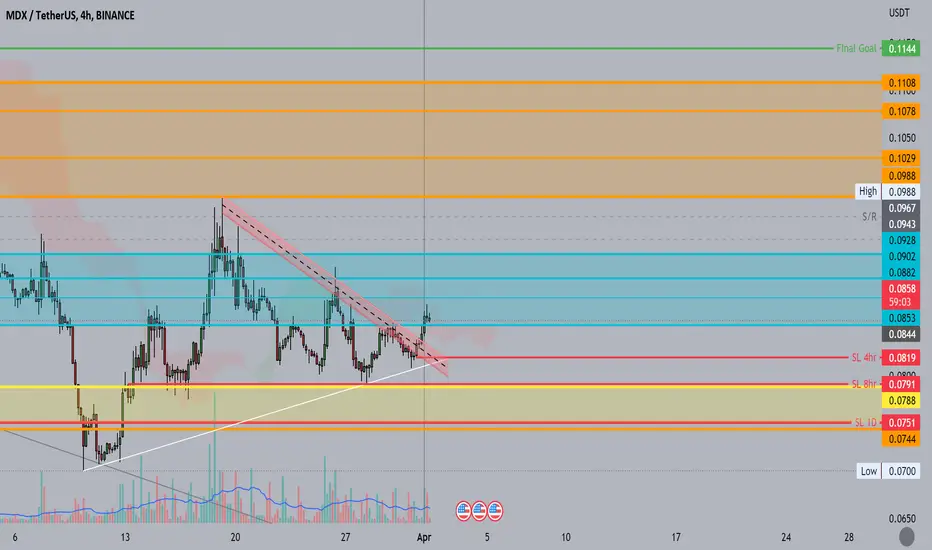
MDXUSDT TODAYPLZ DO NOT SELL MY SIGNALS
1-Apply your own risk management.
2-Daily and Weekly Targets
3-Hunt the profits at any level you see convenient for you.
4-BLUE Zone for entry,
5-Yellow levels are targets.
have a good day guys.

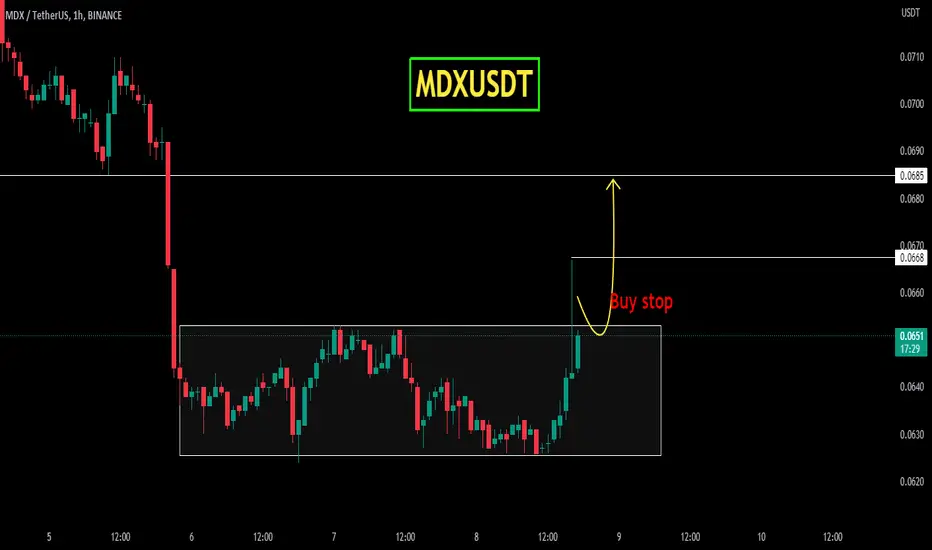
MDXUSDTMDXUSDT was trading in range from last few days, finally today it broke through the range and currently again got range bound. If it gives healthy closing out of the range at 0.655 region, it will be a nice buy setup.
Mdx Looks Pretty Bullish Formed descending Broadening Wedge In htfs & testing Trendline Incase Of breakout expecting 300%+ Bullish Wave In Midterm

✴️ Mdex Part 2 (100% to 300% Growth Potential)This is the Altcoin project for which I shared a trade signal for you just two days ago on the Bitcoin side, MDXBTC.
We will now look at the Tether side, MDXUSDT, because it looks good.
The only reason I share these is because the charts are looking good/strong, with upside potential.
We focus 100% and exclusively on the charts only, we are technical analysts.
MDXUSDT has been producing higher lows since September 2022.
The was a strong bullish breakout after the final low and this is followed by an equally strong correction, this is normal...
After the correction we get a phase of accumulation and then the next high.
✔️ RSI and MACD both are good.
✔️ The candles are good.
✔️ Market conditions are good.
The only variable is the Ethereum situation... Will it really crash the entire market?
Or can Ethereum just go down by itself while the money that leaves Ethereum fuels the rest of the Altcoins up?
Or the positive side... Will the hard-fork lead to growth?
Anyways, this is another bullish chart.
The potential can range from an easy 100%, to a nice 299%+.
This is not financial advice.
Thanks a lot for your support.
Namaste.

MDEX (MDX) - Strong bullish divergenceOf all the tokens in all of Binance, only two look massively bullish at this time.
The first is MDX with a near 70% correction since April. A number of reasons now exist to be long:
1) A strong buy signal prints with multiple oscillators printing positive divergence.
2) Price action breakout from falling wedge formation.
3) RSI resistance breakout.
4) It is the 10/8/& 5-day charts that makes this one particularly bullish. On the 8-day chart a perfect Dragonfly DOJI prints on the BTC pair. Prints on all of the mentioned time frames. These signals are like a catapult to price action.
Is it possible price action falls further? For sure.
Is it probable? No.
WW
Any guesses what the 2nd token is? Get this post to 100 likes in the next 48 hours and I'll publish. In some ways it is more bullish than MDX. It begins with a 'D' ;-)
8-day chart
10-day BTC pair with perfect DOJI following incredible buy
Type: trade
Risk: <=6% of portfolio
Timeframe: 1 to 2 months
Return: Back to April levels from flagpole extension.

Buying opportunity for MDX? Sharing my insightsMDX, despite having a small market value in the crypto world, is catching the attention of investors with its sharp price movements. My technical analysis indicates that MDX's trend break is close and its price is expected to experience a significant increase. My short-term target is to reach $0.40.
However, MDX's small market value means that its price can experience large fluctuations. Therefore, it's important to understand the risks before investing.
MDX has become a project that is on investors' radar, and its sharp price movements have increased its popularity. However, being careful before investing is always important. MDX's small market value can increase the fluctuations in its price. Therefore, I recommend closely monitoring MDX and understanding the risks before investing.
MDXUSDT READY TO FLY 🚀🚀#MDXUSDT
i expect the price will fly to the target at the chart we have very important and strong support zone and we are in over sold area i expect there will be a correction move buy and hold it to the next targets at the chart MACD is showing bullish EMAs is neutral RSI showing bullish Parabolic SAR is bullish Ichimoku cloud is neutral Fib retracement is showing bullish ZELMA is neutral Accumulation distribution is bullish
