Microsoft (MSFT) Testing Critical Support! 📊 Technical Analysis (TA):
1. Trend & Structure:
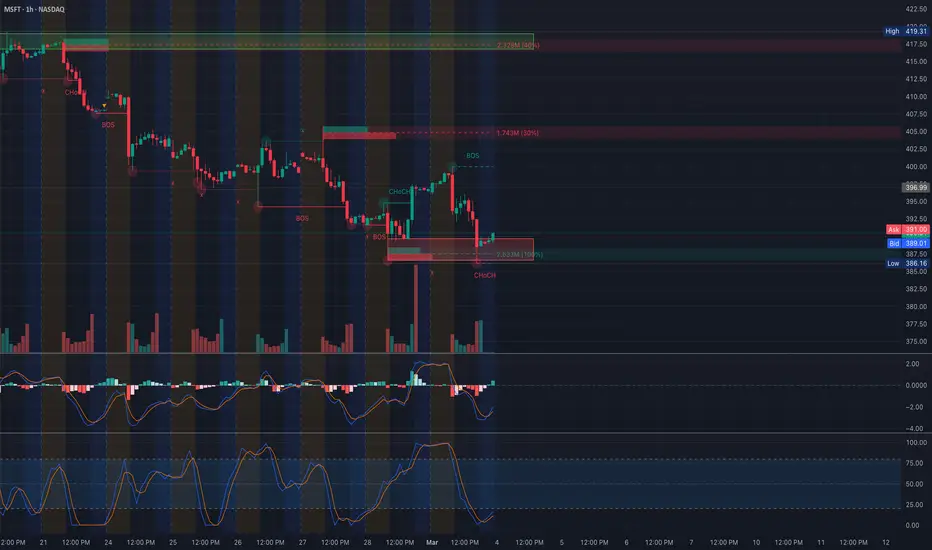
* MSFT has been in a strong downtrend, marked by multiple Break of Structure (BOS) signals.
* Recent Change of Character (ChoCH) suggests a potential bottoming attempt.
* Key Resistance: ~400-415 (supply zone)
* Support Zone: ~385-388 (current demand area)
2. Indicators:
* MACD & Stochastics show early signs of bullish momentum but remain weak.
* Volume spikes indicate selling pressure is still dominant.
🔹 GEX & Options Flow:
1. Call Walls (Resistance) 🚧
* 415-420: Strong resistance, may cap any rally.
* 430: 3rd Call Wall, unlikely to be reached in the short term.
2. Put Walls (Support) 🛑
* 385: Immediate support where puts are concentrated.
* 380: Highest negative NETGEX, meaning if MSFT breaks below, a sharp drop to 360-370 is possible.
3. IV Rank & Skew:
* IVR 53.9, indicating mid-range volatility.
* Low put activity (6.4%), suggesting mixed positioning.
* Implied move: ±2.6%, indicating potential large swings.
📌 Trading Plan & Suggestions:
* Bullish Scenario:
* If MSFT holds 388-390, we could see a bounce toward 400-410.
* Calls or spreads with April expiry could benefit from a rebound.
* Bearish Scenario:
* If MSFT breaks 385, expect a drop toward 380, where put positioning increases.
* Ideal Put Play: Buy March-April 390P or 380P targeting 370-380.
⚠️ Key Warning: If MSFT holds 385-388, a relief rally could squeeze shorts.
🔥 Conclusion: MSFT at Decision Point – Bounce or Breakdown?
Microsoft is testing critical support, with options flow suggesting downside risk. The next sessions will determine if bulls defend or bears extend losses. Watch for price action near 385-390 before making a move. 🚀📉
🚨 Disclaimer:
This analysis is for educational purposes only and does not constitute financial advice. Always do your own research and trade responsibly.
MSFT trade ideas
Microsoft - its going downYes even the big 7 have to make a break, the market only works because of retracements. Otherwise there wouldnt be that much buying power.
Microsoft still has a great business but they will be losing a lot of customers in the future. First of all one of their best business models was the xbox console and their xbox live subscriptions. The gaming trend comes to an end since people dont really like to play that much anymore because of bad games and social media. The gaming sector still makes 10% of Microsofts income which is a lot. Next problem Microsoft has is their subscription model. Its too expensive. There are many companies ready paying for Office. But there are already a lot of great alternatives and there will be more. I have a huge problem with Microsofts business model, its an old modell which is slowly dying, even with the status of a monopolist. If they still want to be part of the big 7 they have to be more creative in the future.

Microsoft Bounce off Support. MSFTElliott picture is unclear, yet there are signs of undergoing pivot. There is a fairly massive engulfing bullish candle that crosses both vWAP and US lines. There is a cross on the VZO, Ehler's Stochastic that occurred simultaneously. BB %PCT looks to cross soon as well. The stop loss is pretty tight, good luck in your trading.

Microsoft Boosts Investments in SpainBy Ion Jauregui - ActivTrades Analyst
Microsoft continues to consolidate its presence in Aragon with the investment of 2.9 billion euros in a new data center in Zaragoza, reinforcing its commitment to growth in the region. This center is in addition to other projects that Microsoft has previously announced, totaling nearly 10,000 million euros in investments in Aragon. The new facility will be built in Parque Venecia, covering an area of 59 hectares, and will be developed in several phases, starting in 2026. Construction will create between 1,000 and 2,000 jobs, while once operational, the center will generate 300 jobs related to engineering and operation of critical systems.
This expansion is part of Microsoft's global effort to expand its cloud infrastructure, with the aim of strengthening its Azure-based service offering, boosting artificial intelligence and other digital services. The economic impact in Aragon is estimated at €2,685 million over the period from 2026 to 2030. This investment also underlines the company's commitment to regional development, following the line of other centers that Microsoft has installed in La Muela and Villamayor de Gállego, which are also designed to support the growth of cloud technology.
Microsoft Financial Data
In terms of its share price, Microsoft (MSFT) reported a decline of 2.09%, with a value of $388.58 per share as of recently. Throughout its last fiscal year, the company achieved annual revenues in excess of $200 billion, with net income of approximately $70 billion. Its growth remains robust, driven primarily by its cloud division and the continued development of its artificial intelligence platform, Azure.
Technical analysis.
Over the past week, Microsoft (MSFT) shares have trended lower. Below are the closing prices and daily ranges between 399.32 and closing at 388.49 with a premarket forecasting declines. The stock is currently trading at the last support zone that led the push to the highs. Currently the checkpoint is at 414.35 well above the current zone. RSI is at 32.05% in excessive oversold, so it is predictable a reversal to the middle zone of the control point because the company is not excessively overpriced.
*******************************************************************************************
The information provided does not constitute investment research. The material has not been prepared in accordance with the legal requirements designed to promote the independence of investment research and such should be considered a marketing communication.
All information has been prepared by ActivTrades ("AT"). The information does not contain a record of AT's prices, or an offer of or solicitation for a transaction in any financial instrument. No representation or warranty is given as to the accuracy or completeness of this information.
Any material provided does not have regard to the specific investment objective and financial situation of any person who may receive it. Past performance is not reliable indicator of future performance. AT provides an execution-only service. Consequently, any person acing on the information provided does so at their own risk.

MSFT - Melt up & Crash series [1] I predict it will backtest the ascending wedge. Estimated to be around May 30th 2025.
The Ichimoku cloud also acts as extra support as usually it requires two attempts to break a cloud (entering then exiting then re entering. I only see one. - Personal observation - I don't know why.

MSFT Technical Analysis – Reversal in Progress?Market Structure & Key Levels
* Current Price: $400.90
* Support: $388.61, $381.00
* Resistance: $410, $415, $420
MSFT has shown bullish momentum after rebounding from the demand zone near $381. It has broken multiple Change of Character (ChoCH) patterns to the upside, indicating a shift from bearish to bullish structure.
Reversal Zone Analysis
MSFT recently bounced off a key liquidity zone and is now entering a potential reversal area between $400 - $410. If price sustains above $400, further upside toward $415 and $420 is possible.
Options & GEX Analysis
* IVR: 44.4
* IVx Avg: 29.2
* GEX: Green (indicating bullish positioning)
* Put Walls: $385, $380
* Call Walls: $410, $415, $420
Options flow suggests that MSFT is seeing increased bullish positioning, with notable put support at $385 and a gamma resistance wall at $410.
Trading Plan & Strategy
Bullish Scenario (Preferred)
* Entry: Above $400 with strong volume confirmation
* Target: $410, then $415
* Stop-Loss: Below $395
Bearish Scenario (Less Likely)
* Entry: If price rejects $405-$410 zone
* Target: $390
* Stop-Loss: Above $410
Options Trade Idea
* Bull Call Spread: Buy $400 Calls, Sell $415 Calls (April Expiry)
* Credit Put Spread: Sell $390 Puts, Buy $380 Puts
Final Thoughts
MSFT appears bullish in the short term, with momentum picking up. Watch for a clean breakout above $400 and whether price can sustain above $405. If rejected, expect a pullback to $390-$385.
Disclaimer:
This analysis is for educational purposes only and not financial advice. Please do your own research and manage risk accordingly.

A potential bullish reversal for Microsoft can be beneficial nex
- Key Insights: Microsoft's stock is at a critical support level around $390,
presenting an opportunity for long positions if this level holds. The recent
rebound in tech stocks indicates a shift in investor sentiment that could
strengthen Microsoft's performance. With broader market dynamics leaning
towards recovery, traders should watch for potential upward movements if the
stock can sustain above key support.
- Price Targets:
- Next week targets: T1=400, T2=406
- Stop levels: S1=389, S2=385
Price level rules specified indicate a strong alignment for a long position.
- Recent Performance: Microsoft has faced significant pressure, nearing 52-week
lows, yet recent trends in broader indices provide hope as the tech sector
showcases resilience. The stock is closely tied to broader market movements,
and maintaining above the critical support level could signal a recovery.
- Expert Analysis: Analysts remain cautiously optimistic with the potential for
bullish reversals if key support levels are maintained. The current
macroeconomic context, including stabilizing interest rates and oil prices,
could positively influence Microsoft's stock. Experts highlight the
importance of these dynamics for any forthcoming upward momentum.
- News Impact: While no major announcements directly linked to Microsoft have
been made recently, significant partnerships in cloud computing and data
centers highlight the company's growth trajectory. The overall bearish
trends this year have led to discussions about potential market corrections,
with recent trading sessions showing recovery signs among major tech stocks,
including Microsoft.

MICROSFT ANALYSIS ShortI have analyzed Microsoft and found that it is in down trend. I have used trend & Gann level to conclude on this. First target achieved yesterday. Second & third target will also come in coming days.
I am also available on X with "skumarinsweden".

Looking bullish on MSFT! 🔉Sound on!🔉
📣Make sure to watch fullscreen!📣
Thank you as always for watching my videos. I hope that you learned something very educational! Please feel free to like, share, and comment on this post. Remember only risk what you are willing to lose. Trading is very risky but it can change your life!

Which Way Is MSFT Currently Leaning?1. Bull Case Scenario
The current zone near $386 is a pivotal horizontal support. If MSFT stabilizes here and buyers step in, a short‐term bounce is likely.
Moving averages are converging around $401–$410. A daily close above this band(~420—would signal a bullish reversal attempt.
RSI near 40–45: A push back above 50 would hint that momentum is shifting bullish again.
Stochastics are in the lower range (30s), so a crossover back up can foreshadow a price rebound.
PMO (Price Momentum Oscillator) turning from negative to positive would reinforce a new upswing.
Upside Targets
First target: $417–$418 (overhead volume node + prior swing high).
Next: Potential retest of $450–$465 if the broader market and fundamentals align.
Follow‐through above $420 to confirm the trend change.
2. Bear Case Scenario
Descending Trendline & Lower Highs:-The teal trendline from the peak (~$465) remains intact. Price making lower highs confirms a short‐term downtrend unless it breaks above $420.
Losing $386 support signals bears remain in control.
Next Supports:
$367 → Moderate volume node and horizontal pivot.
$335 → Deeper support aligned with a larger volume shelf.
$307 / $269 → Major downside targets if selling accelerates.
Momentum Indicators Lean Bearish
RSI < 50 and PMO negative both favor continued downside.
Stochastics near oversold can trigger short bounces, but until price reclaims key MAs, rallies may fail.
Downside Targets
A daily close below $386 would initially open the door to $367. If that fails, $337–$307 come into play.
What to Watch
Momentum Confirmation: If RSI stays under 50 and PMO remains negative, it strengthens the bearish bias.
Volume Spike on a breakdown: Confirms heavier selling pressure.
3. Which Way Is MSFT Currently Leaning?
Short‐Term Bias: Neutral‐to‐Bearish
Price is below the short‐term MAs, RSI is under 50, and PMO is negative—tilting momentum to the downside.
The $386 level is the last near‐term defense for the bulls.
Potential for a Bounce:
If $386 holds and momentum oscillators (RSI, Stochastics) turn up, expect a test of $401–$410.
Key Inflection:
A breakdown below $386 → more downside.
A breakout above $410 → potential trend reversal.
Overall, bears have the edge unless MSFT can reclaim its short‐term MAs and push RSI back above 50.

Microsoft Corp LONGBullish Gartley
MSFT MICROSOFT CORPORATION
As always, idea that needs further multiple confirmations.

MSFT daily hammer candleDaily hammer candle on Friday indicate potential temporary bottom.
Typically, a position would be open on late Friday before close to capitalize on potential second green daily candle.
Personally would only hold trade 1 day and close it on high of the day of next Monday since there's no sign of reversal on the weekly and monthly.
Or hold it till it reaches a level or MA or a closed reversal candle.

$MSFT $SNOW sympathy play, $390-$400 SupportNASDAQ:MSFT NYSE:SNOW — Microsoft is like a snail in this AI/ Tech race but I suppose that shows strength because no major drops and holding zones well. Bottoms after bottoms. I’m looking for short term calls here. As of today, ending week 2/28, I may try $405c. But can see this retest the $420s weeks to come.
WallStreetLoser


Microsoft’s Momentum Could Be FadingMicrosoft has sputtered for months, and now some traders may see downside risk.
The first pattern on today’s chart is the pair of bearish gaps after earnings.
The software giant rebounded quickly in November, returning above its 21-day exponential moving average (EMA) and 200-day simple moving average (SMA).
Contrast that with January 30’s drop, when prices stayed under both moving averages. That session’s opening price around $418.77 has also emerged as resistance this month.
Second, the 50-day SMA is nearing a potential “death cross” below the 200-day SMA. That’s a potentially bearish long-term signal.
MACD has been negative and the 8-day EMA is below the 21-day EMA. Those are potentially bearish short-term signals.
Next, the stock has been trying to hold the November lows around $405. But if that level breaks, the August low under $386 may come into play.
Finally, MSFT has traded an average of 463,000 options contracts per day in the last month. (It’s the eight most active underlier in the S&P 500 in that time, according to TradeStation data.) That may create opportunity for options traders to position for a potential move toward the 52-week low.
TradeStation has, for decades, advanced the trading industry, providing access to stocks, options and futures. If you're born to trade, we could be for you. See our Overview for more.
Past performance, whether actual or indicated by historical tests of strategies, is no guarantee of future performance or success. There is a possibility that you may sustain a loss equal to or greater than your entire investment regardless of which asset class you trade (equities, options or futures); therefore, you should not invest or risk money that you cannot afford to lose. Online trading is not suitable for all investors. View the document titled Characteristics and Risks of Standardized Options at www.TradeStation.com . Before trading any asset class, customers must read the relevant risk disclosure statements on www.TradeStation.com . System access and trade placement and execution may be delayed or fail due to market volatility and volume, quote delays, system and software errors, Internet traffic, outages and other factors.
Securities and futures trading is offered to self-directed customers by TradeStation Securities, Inc., a broker-dealer registered with the Securities and Exchange Commission and a futures commission merchant licensed with the Commodity Futures Trading Commission). TradeStation Securities is a member of the Financial Industry Regulatory Authority, the National Futures Association, and a number of exchanges.
Options trading is not suitable for all investors. Your TradeStation Securities’ account application to trade options will be considered and approved or disapproved based on all relevant factors, including your trading experience. See www.TradeStation.com . Visit www.TradeStation.com for full details on the costs and fees associated with options.
Margin trading involves risks, and it is important that you fully understand those risks before trading on margin. The Margin Disclosure Statement outlines many of those risks, including that you can lose more funds than you deposit in your margin account; your brokerage firm can force the sale of securities in your account; your brokerage firm can sell your securities without contacting you; and you are not entitled to an extension of time on a margin call. Review the Margin Disclosure Statement at www.TradeStation.com .
TradeStation Securities, Inc. and TradeStation Technologies, Inc. are each wholly owned subsidiaries of TradeStation Group, Inc., both operating, and providing products and services, under the TradeStation brand and trademark. When applying for, or purchasing, accounts, subscriptions, products and services, it is important that you know which company you will be dealing with. Visit www.TradeStation.com for further important information explaining what this means.

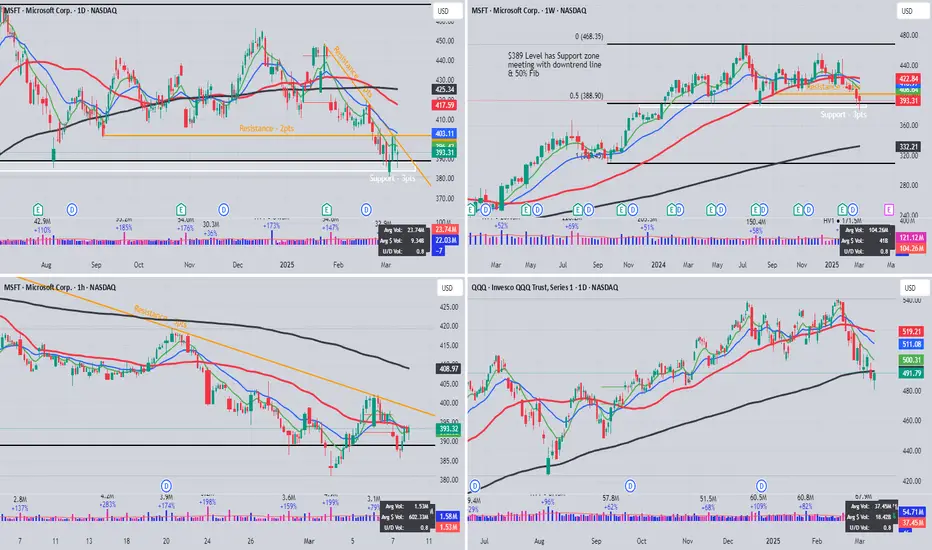
MSFT Multi Timeframe analysesMSFT Charts showing confluence at the $389 level. There are support & resistance lines meeting with 50% Fib.
Volume is higher at trendline touches but not extreme.
Microsoft shortThese apple are target for short in Microsoft. Trend and Technical has been used along with Gann price and time.

$MSFT: Rhymes of $BA Diamond NASDAQ:MSFT with a 🔷 look on the weekly and monthly. Not quite NYSE:BA 2019 level; however, a concerning look. Lower BB on both daily and weekly open and moving down 🚩
If wanting to "invest" in this #M7 name better to wait for potential drop or for it to recover above $420. Otherwise we may be looking at a backtest of that large cup and handle breakout and a visit to 200ema on weekly

MSFT BEARISH
MSFT to 375.
I won't be shorting but rather avg'ing into positions...
Well I might intraday short, but def not swings since this company could get some bullish news.
Looks bearish to me atm. Buyers are not stepping in after we've lost that key 400 level.

$MSFT – Breakdown Confirmed, Bearish Pressure Mounting?NASDAQ:MSFT
The stock broke key support at $404.37 in yesterday’s session, signaling a potential for further downside. This breakdown confirms the breach of a major consolidation triangle that had been forming since the August 5, 2024 lows, following a sharp decline from $468.35.
🔹 Bearish Scenario – Lower Levels in Focus:
With the triangle breakdown confirmed, price action suggests continuation to the downside. A Bullish Deep Crab pattern could emerge if the stock reaches $373.02 , aligning with the 161.8% Fibonacci extension level. This level also converges with the 38.2% Fibonacci retracement, making it a key area to watch for potential stabilization.
🔹 Key Levels to Watch:
📉 Support: $404.37 (broken), $373.02 (deep crab PRZ), key retracement levels
📈 Resistance: $412.85, $423.40, $437.22
💡 Momentum remains bearish, and we should monitor whether the stock accelerates toward the $373.02 zone, where a technical bounce could develop.
Is NASDAQ:MSFT heading for deeper correction, or will the deep crab pattern play out? Let’s discuss in the comments! 📉
Happy Trading,
André Cardoso
💡Risk Warning: Trading financial assets carries a high level of risk and may result in the loss of all your capital. Make sure to fully understand the risks involved before you start trading and carefully consider your investment objectives, level of experience, and risk tolerance. The data and information provided in this content do not constitute financial or investment advice and should not be considered as such. Only invest what you can afford to lose, and be aware of the risks associated with trading financial assets.

MSFT ChannelBetween January 2023 and July 2024 NASDAQ:MSFT had a nearly 100% expansion showing aggressive growth. For the last 8 months however, MSFT has been trading sideways in a channel between ~$455 and ~$400. During the last earnings report future growth guidance came in under expectations. Technically, there was large gap down following earnings and a retraction to the 21 EMA offering a short entry window. I took a short position here with a stop loss placed above the 21 EMA, I will be adding to this position when price breaks the support of $400 and again if it continues to fall and retracts to the $400 level. First target is the previous $373 support level, second target is the $330 support level.

OpX is out of way, NVDA earnings aheadAfter another wild and crazy sell off last Friday due to options expiring, markets have one more obstacle to get through this week before it can finally make its next big move be it up or down. Nvda earnings Wednesday post market cant come soon enough.

MSFT Following GOOG's Path? Targeting $350Hello Traders,
I’m sharing my analysis of the MSFT weekly chart. The price has bounced off the upper main channel line around $465.
Looking at the previous wave, it consisted of an uptrend (blue progression channel) lasting 94 weeks and a downtrend (grey channel) lasting 42 weeks, totaling 136 weeks. I’ve highlighted a yellow rectangle showing the price action after exiting the blue channel. Let's apply the same logic to the current wave, which started in January 2023.
The price has now exited the uptrend portion of the current wave (blue channel) and is retesting the broken channel's lower line, similar to what we observed in the yellow rectangle. Therefore, I expect a downtrend channel to form, potentially targeting $350 over the next 45 weeks.
I've aimed to make this analysis straightforward, and you'll notice that MSFT is exhibiting a pattern similar to GOOG, with two waves in a long-period progression channel.
Happy trading!
NASDAQ:MSFT
