MUBARAK/USDT – Accumulation Ending? Double Bottom Signals Revers📊 Technical Overview: After a prolonged downtrend and descending wedge, MUBARAK has entered a consolidation range — clear signs of accumulation. The price has now bounced twice off the key support level at $0.003484, forming a textbook double bottom.
📈 Key Bullish Signals:
✅ Strong horizontal supp
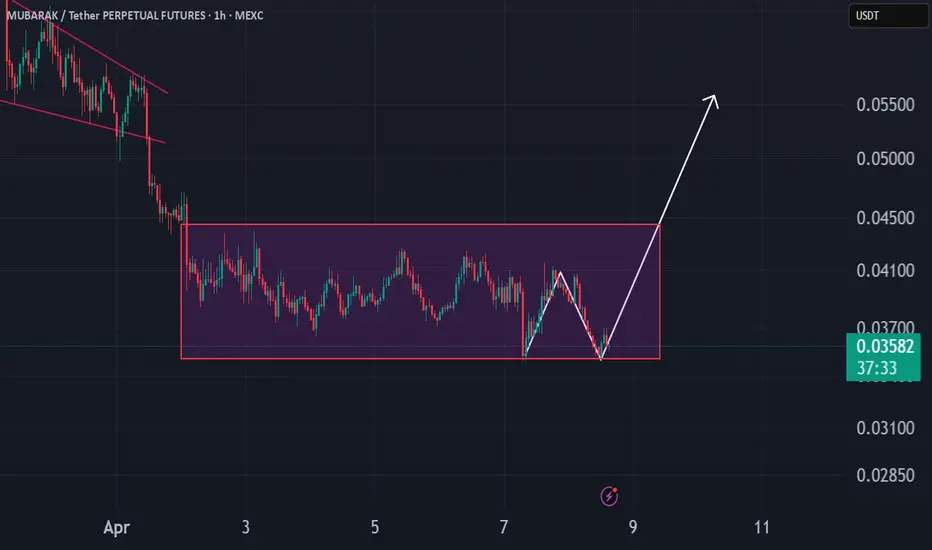
MUBARAK Long Trade SetupMUBARAK is a newly listed coin, and it is currently in a good position to rebound. I am expecting at least 150% to 200% rally soon.
Strategy:
~ Entry: $0.0375 to CMP.
~ Stop Loss: $$0.033.
~ Leverage: 5x to 10x.
~ Target: $0.051, $0.063, $0.085, $0.11.
Note: Always do your own analysis before inv

MUBARAKUSDTWe can attempt to short MUBARAKUSDT from specified level as it make LH , also there is no bullish divergence occur indicate that it moves downward.

NEXT 30% TP IN MUBARAK/USDTFAST TRADE for 01/04/2025
ENTRY - 0.049
TP - 0.062
stop loss - 0.47 / 1H CLOSE

MUBARAK Roadmap (4H)The MUBARAK correction seems to have started from the point where I placed the red arrow on the chart.
The pattern could be a symmetrical, diametric, or expanding triangle. A strong demand zone lies ahead of the price, where we can look for buy/long positions.
Targets are marked on the chart.
A d

MUBARAK sell/short setup (2H)Given the bearish CH in lower timeframes and the formation of a supply zone, a downward move is expected.
There is a liquidity pool and an order block at the bottom of the chart, and candles are expected to move downward toward this area soon.
The closure of a 4-hour candle above the invalidation

MUBARAKUSDT Hourly Technical AnalysisMUBARAKUSDT Hourly Technical Analysis
Mubarak Coin is currently in a recovery phase after being affected by Bitcoin’s decline. After forming support at 0.1288, it has reached the 0.1381 resistance level. At this level, it appears very close to the 21-day moving average. If it manages to stay above

MUBARAKUSDT Hourly Technical AnalysisMUBARAKUSDT Hourly Technical Analysis
Mubarak Meme Coin has shown a positive breakout in the 1-hour technical analysis, breaking above the 0.13552 resistance level. Currently, it has broken above the 0.15057 resistance and surged up to 0.16595 resistance, increasing the risk of potential profit-tak

MUBARAK/USDTKey Level Zone: 0.1380 - 0.1420
HMT v7 detected. The setup looks promising, supported by a previous upward/downward trend with increasing volume and momentum, presenting an excellent reward-to-risk opportunity.
HMT (High Momentum Trending):
HMT is based on trend, momentum, volume, and market struc

MUBARAKUSDT Hourly Technical AnalysisMUBARAKUSDT Hourly Technical Analysis
In the 1-hour technical analysis of the newly listed Mubarak Meme Coin, it is moving at the same level as the 21-day price average. Indicators are positive, and the price is consolidating in a sideways range, fluctuating between 0.130 - 0.150.
This meme coin i

See all ideas
Summarizing what the indicators are suggesting.
Oscillators
Neutral
SellBuy
Strong sellStrong buy
Strong sellSellNeutralBuyStrong buy
Oscillators
Neutral
SellBuy
Strong sellStrong buy
Strong sellSellNeutralBuyStrong buy
Summary
Neutral
SellBuy
Strong sellStrong buy
Strong sellSellNeutralBuyStrong buy
Summary
Neutral
SellBuy
Strong sellStrong buy
Strong sellSellNeutralBuyStrong buy
Summary
Neutral
SellBuy
Strong sellStrong buy
Strong sellSellNeutralBuyStrong buy
Moving Averages
Neutral
SellBuy
Strong sellStrong buy
Strong sellSellNeutralBuyStrong buy
Moving Averages
Neutral
SellBuy
Strong sellStrong buy
Strong sellSellNeutralBuyStrong buy