Natural Gas Faces Strong Sell-Off Amid Oil CrashNatural Gas Faces Strong Sell-Off Amid Oil Crash
Natural Gas (NG) has once again tested the 4.2 resistance zone, encountering a strong sell-off as sellers positioned themselves for better selling opportunities.
So far, NG has broken below another key support level, increasing the likelihood of further downside movement. This decline aligns with the sharp oil crash, which was fueled by OPEC+ comments on increasing oil production.
While the bearish wave in NG is still unfolding, its pace is slower than usual. However, the overall trend suggests that the price is moving in the right direction for further declines.
You can watch the analysis for further details!
Thank you and Good Luck!
❤️PS: Please support this analysis with a like or comment if you find it useful for your trading day. ❤️
NATURALGAS trade ideas

NATGAS - Long Opportunity with a H&S TF 15 minThere is a H&S configuration.
We have to break the neck line.. if is will happen, we can have a new long wave until area 4.2

Gas: Downtrend Confirmed, Tactical Shorts & Simplified Analysis🔥 #GasHasNoMercy | 📉📈 #TechnicalAnalysis
📉 Well, the era of predictable gas trends in recent weeks seems over. Ironically, the downtrend has confirmed across all timeframes, but our wave count 🌊 and decline structure had to be revised.
🚫📉 Gas failed to show the expected impulsive downward waves. Moves were choppy—corrective triples, diagonals. Yet, we adapted and traded cautiously. Didn’t dissect every trade, but even a small profit ✅💰 was secured.
🛑📉 Now, waiting for a crash seems futile. Options: trade with surgical precision or step back until a clear pattern forms ⚠️⏳. Shorting from resistance levels or moving averages 📌🎯 could work, but lock profits fast. Avoid longing 🚫📈—gas forgives no mistakes. The chart reflects my current scenario. Alternatives exist, but in uncertainty, stick to basics: moving averages, levels, RSI. Wave guessing? Shelved for now.
💬 Your thoughts?
🔄 Agree with the tactics? Comment below ➡️

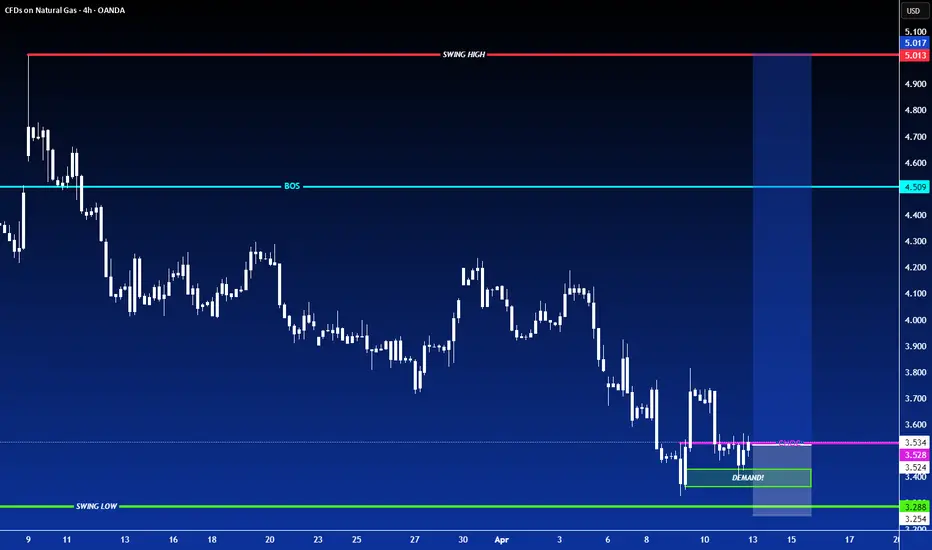
LONG ON NATURAL GASNATGASUSD
Natural gas has finished its pullback to the downside within its overall uptrend.
Price has given us a choc (change of character) to the upside and has also pulled back to a strong demand area.
I expect price to rise majorly on Gas to the next supply level.
ngas buying nGAS 3.45
sl 3.23
tp 4.47
1% risk each trade
buyin in on gas
pre open markets .
like an follow

Natural Gas is in the Buy DirectionHello Traders
In This Chart NATGAS HOURLY Forex Forecast By FOREX PLANET
today NATGAS analysis 👆
🟢This Chart includes_ (NATGAS market update)
🟢What is The Next Opportunity on NATGAS Market
🟢how to Enter to the Valid Entry With Assurance Profit
This CHART is For Trader's that Want to Improve Their Technical Analysis Skills and Their Trading By Understanding How To Analyze The Market Using Multiple Timeframes and Understanding The Bigger Picture on the Charts

NATGAS - Long TriggerI have a triger for a Long with target around 4,2$
Stop below actual support zone

NATURAL GAS | Entering HEAVY LONG NATURAL GAS | Entering HEAVY LONG at the bottom of a manufactured squeeze – here's the full breakdown:
What’s happening in XNG/USD right now is not a normal correction. This is a textbook smart money squeeze disguised as bearish sentiment.
Let’s strip the noise and look at the reality:
THE SETUP:
Natural gas just dropped from ~$5.00 to ~$3.34 in 9 weeks — a ~33% crash —
without a major fundamental driver to justify it.
And yet, everyone is waiting for "3.2" like it’s destiny.
But here’s the truth:
When retail consensus is that obvious, it’s already being used against them.
We’re watching a structured liquidation event, not a freefall.
It’s designed to look weak, feel heavy, and drive weak hands to exit.
But under the surface:
Price is holding the last strong demand zone
Volume is drying up on down candles
Wicks are increasing → liquidity grabs
The market refuses to break with conviction
→ This is controlled. And calculated.
THE SQUEEZE THEORY IN PLAY:
What you’re seeing now is a squeeze bottom engineered by smart money:
Trap liquidity below demand (under 3.35–3.40)
Trigger stop-losses & breakout shorts
Absorb all panic sells from impatient longs and confident bears
Fake breakdown → no follow-through
Hold → then reverse with speed
This is how they load up without pushing price up.
Once complete → launch the narrative, break structure, and squeeze the shorts.
And that’s where we are right now.
THE CATALYSTS ARE BREWING:
This move isn’t technical — it’s preparatory. The narrative is loading in the background:
EU might drop all Russian gas contracts → demand for U.S. LNG explodes
Trump’s tariff games create global energy anxiety → price insurance gets baked in
U.S. LNG exports are at ATH
Storage is still below 5Y average
And ironically, everyone’s ignoring this... waiting for "just one more drop"
This is exactly what smart money wants:
→ Everyone focused down, while the position builds up.
MY TRADE STRUCTURE:
Entered LONG here (3.34–3.36 zone)
Stop-loss below 3.25 (beneath the trap zone)
First target: 3.75 (range top reclaim)
Second target: 4.00–4.18
Holding a runner for 4.50+ if chaos breaks out (EU gas panic, export shock, etc.)
FINAL THOUGHT:
This is a market where manipulation isn't a theory — it's the method.
You don’t get clean signals. You get fear, noise, and misdirection.
But when volume dries, structure holds, and headlines wait in silence…
You’re not in danger — you’re in the final stage before ignition.
I’m not chasing the obvious. I’m front-running the pivot.
Let’s see if the market’s ready to show its real face.
#XNGUSD #NaturalGas #SmartMoney #SqueezeTheory #MacroPsychology #Wyckoff #LongFromTheAshes #TradingView

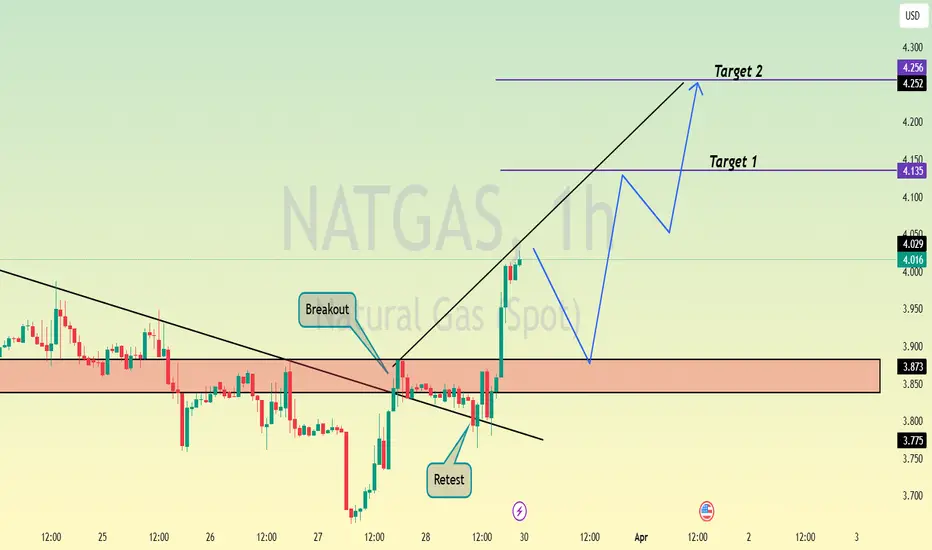
NG bullish (SHORT TERM)Key bullish level: $3.77 , $4.04 and $4.26
Key bearish level: $3.41 , $3.25 and $3.02
I am only considering the recent strong bullish swing from £2.99 - $4.9.
So far we have seen market structure shift and the a clean break of structure indicating reversal.
Since the trend line is acting as a nice supp there is a good chance of a big demand and we recently had a big daily engulfing candle. The next candle is bearish but isnt engulfing and the latest is the green hangman signalling further bullish move.
Since April is bullish as seen per historical data we might see the price climbing up soon.
The price will most definitely come to test $4.04 FVG and then see where it will go from there.
A gap up is expected at next open. If there is a break in 1D bullish trendline then a big possibility to tap in deeper FVG @ 3.2.
So atm, too many speculations and so so, much is going on after end of financial year and the markets correcting itself.
Hope you have a nice trading week! All the best, everyone!

XNGUSD Bullish Crab Pattern.Attention investors and energy enthusiasts!
The natural gas market is heating up with exciting developments.
We anticipate a significant surge in natural gas prices, projected to rise from $3.65 to $4.35 in three strategic phases based on Crab Harmonic Pattern .
This forecast reflects a robust demand landscape and evolving market dynamics. As the energy sector continues to adapt, seizing this opportunity could position you ahead of the curve.
Stay informed and take action now!
Embrace the potential for growth in natural gas investments.
SEYED.

"XNG/USD Natural Gas" Energy Market Heist Plan (Scalping/Day)🌟Hi! Hola! Ola! Bonjour! Hallo! Marhaba!🌟
Dear Money Makers & Robbers, 🤑 💰💸✈️
Based on 🔥Thief Trading style technical and fundamental analysis🔥, here is our master plan to heist the "XNG/USD Natural Gas" Energy Market. Please adhere to the strategy I've outlined in the chart, which emphasizes long entry. Our aim is to escape near the high-risk ATR Zone. Risky level, overbought market, consolidation, trend reversal, trap at the level where traders and bearish robbers are stronger. 🏆💸"Take profit and treat yourself, traders. You deserve it!💪🏆🎉
Entry 📈 : "The vault is wide open! Swipe the Bearish loot at any price - the heist is on!
however I advise to Place sell limit orders within a 15 or 30 minute timeframe most nearest or swing, low or high level for Pullback Entries.
Stop Loss 🛑:
📌Thief SL placed at the nearest/swing High or Low level Using the 2h timeframe (3.800) Day/Scalping trade basis.
📌SL is based on your risk of the trade, lot size and how many multiple orders you have to take.
🏴☠️Target 🎯: 3.200
🧲Scalpers, take note 👀 : only scalp on the Long side. If you have a lot of money, you can go straight away; if not, you can join swing traders and carry out the robbery plan. Use trailing SL to safeguard your money 💰.
⛽💨"XNG/USD Natural Gas" Energy Market Heist Plan (Scalping/Day) is currently experiencing a bullishness,., driven by several key factors. 👇👇👇
📰🗞️Get & Read the Fundamental, Macro Economics, COT Report, Inventory and Storage Analysis, Seasonal Factors, Sentimental Outlook, Intermarket Analysis, Future trend targets & Overall Outlook Score... go ahead to check 👉👉👉🔗🔗
⚠️Trading Alert : News Releases and Position Management 📰 🗞️ 🚫🚏
As a reminder, news releases can have a significant impact on market prices and volatility. To minimize potential losses and protect your running positions,
we recommend the following:
Avoid taking new trades during news releases
Use trailing stop-loss orders to protect your running positions and lock in profits
💖Supporting our robbery plan 💥Hit the Boost Button💥 will enable us to effortlessly make and steal money 💰💵. Boost the strength of our robbery team. Every day in this market make money with ease by using the Thief Trading Style.🏆💪🤝❤️🎉🚀
I'll see you soon with another heist plan, so stay tuned 🤑🐱👤🤗🤩

NATGAS Found Support at $3.43: Next Target Could be $3.084FenzoFx—NATGAS failed to stabilize below the $3.43 support, resulted in the prices to bounce. As of this writing, Natural Gas trades slighlty above the support.
From a technical perspective. The recent bounce in the price couldn't form a new higher high. Therefore, it is expected for the prices to fall. But, bears must close and stabilize below the $3.43 support for the downtrend to resume.
>>> Win $160.0 weekly by participating FenzoFx Forex Contest for free.

NATGAS - Bearish Head and ShouldersHello Traders !
The Natural Gas price formed a head and shoulders pattern.
Currently, The neckline is broken !
So, I expect a bearish move📉
_______________
TARGET: 3.2350🎯

Natural Gas is in the Buying DirectionHello Traders
In This Chart NATGAS HOURLY Forex Forecast By FOREX PLANET
today NATGAS analysis 👆
🟢This Chart includes_ (NATGAS market update)
🟢What is The Next Opportunity on NATGAS Market
🟢how to Enter to the Valid Entry With Assurance Profit
This CHART is For Trader's that Want to Improve Their Technical Analysis Skills and Their Trading By Understanding How To Analyze The Market Using Multiple Timeframes and Understanding The Bigger Picture on the Charts
NATGAS is Bearish amid Oversold SignalsFenzoFx—NATGAS is in a downtrend, broke below the $3.66 support. The primary trend is bearish, but a consolidation phase is expected.
In this scenario, Natural Gas may test the 50.0% Fibonacci retracement level at $3.866 before the downtrend resumes. Watch this level for bearish signals, like candlestick patterns.
>>> Trade NATGAS without swap at FenzoFx Decentralized Broker

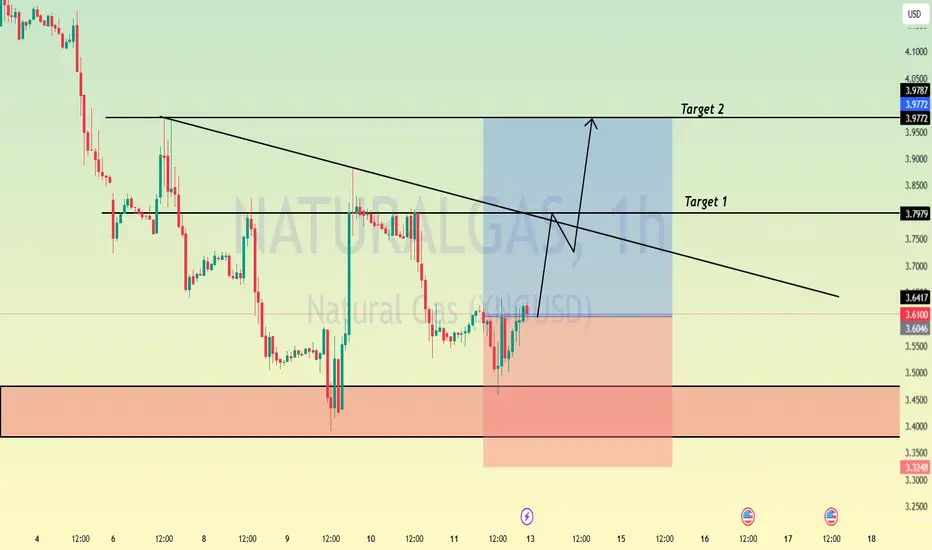
NATGAS - Long Pull Back strategyBig H&S in creation but not completed... so the price at neck line have a reaction without breakout
There is possibility for a new long wave.

Bullish correction before the dropBe careful the market may be setting a huge bear trap the volume in the market isn't matching the price action in the candles. My ideas and Analysis are located on the price chart I do not trade the news or any type of other speculation I trade pure price action I watch the candles I wait then I strike I am new to trading but I am focused on Strictly Natural Gas. I'm looking for a so-called countertrend trade to the broken weekly pivot and my overall biased is still bearish

NATGAS - Head and Shoulder pattern? - SHORTI see a potential H&S pattern short in formation
It can be completed with break of neck line ..
Aggressive trade can be do with an entry and stop loss above the actual max.


Record Production + Mild Weather = Short Natural GasRecord Production + Mild Weather = Short Natural Gas
First Target $3.08 gap fill from 2nd February 2025, Second Target $2.86 gap fill from 11th November 2024.
Current market data and analysis as of Tuesday, April 15, 2025, suggest that Natural Gas prices are under bearish pressure and likely to continue dropping from the current level of around $3.33.
Record US production: U.S. natural gas output hit a record daily high of 107.4 billion cubic feet over the recent weekend, surpassing previous records. April production is projected to remain at these elevated levels, increasing supply pressure.
Mild weather forecasts: Warmer-than-usual temperatures are expected to persist through late April, reducing heating demand in key markets like the U.S. and Europe. This seasonal demand drop is weighing on prices.
Lower demand forecasts: Recent forecasts indicate lower natural gas demand for the upcoming weeks compared to earlier estimates, further pressuring prices.
Inventory levels: U.S. gas inventories are about 4% below the five-year average due to cold spells earlier in the year, but ongoing injections and high production may replenish stocks, limiting price support.
Global price trends: Natural gas prices in Europe and North America have already seen significant declines in early April, influenced by seasonal demand drops and falling oil prices, which are correlated with gas prices.
Market forecasts: While some long-term forecasts expect prices to rise later in 2025 and 2026, near-term models and market sentiment remain bearish, with natural gas futures recently hitting a nine-week low near $3.30.
The combination of record-high production, mild weather reducing heating demand, and lower demand forecasts is creating bearish momentum in natural gas prices. Given these factors, it is likely that Natural Gas will continue to drop further from the current $3.33 level in the near term.
However, watch for potential support if inventories tighten or demand unexpectedly rises, but current data strongly favors continued price weakness.
Use a stop loss. I could be wrong. DYOR. This is not investment advice.
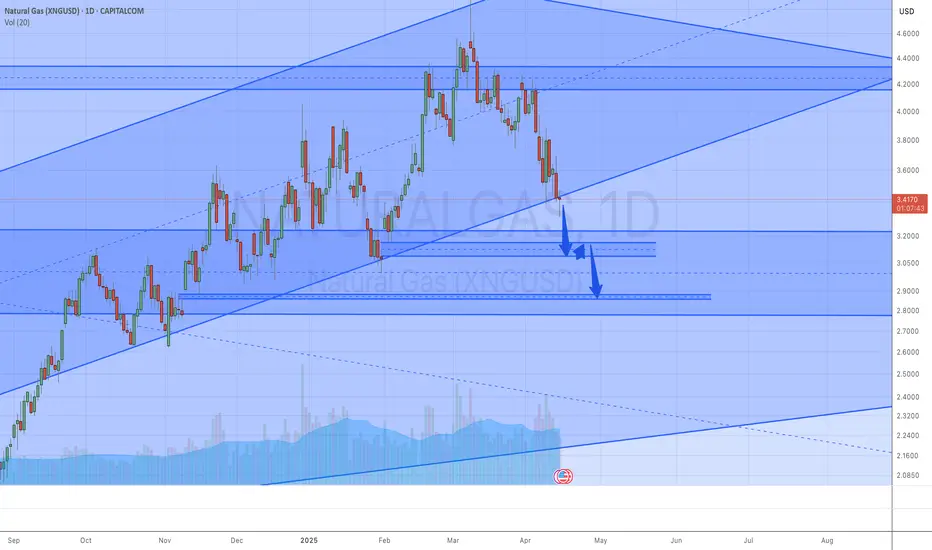
Fiery Butterfly of Natural Gas Price in 2025. In the previous analysis, we predicted the natural gas price trends from 2022 to the end of 2024 using harmonic patterns, which turned out to be highly profitable .
Now, in this idea, we aim to forecast the price movement for 2025 Based on the harmonic patterns, it seems likely that gas prices will rise and reach the golden level of the Butterfly pattern before experiencing a significant drop.

Head and Shoulders Potential on the Daily Natgas ChartHead and Shoulders Potential on the Daily Natgas Chart.
If Production keeps coming online, could easily achieve this target.
Not to mention that winter 2025 is expected to be warm, similar to 2023 - 2024

Natural Gas is in the Buying DirectionHello Traders
In This Chart NATGAS HOURLY Forex Forecast By FOREX PLANET
today NATGAS analysis 👆
🟢This Chart includes_ (NATGAS market update)
🟢What is The Next Opportunity on NATGAS Market
🟢how to Enter to the Valid Entry With Assurance Profit
This CHART is For Trader's that Want to Improve Their Technical Analysis Skills and Their Trading By Understanding How To Analyze The Market Using Multiple Timeframes and Understanding The Bigger Picture on the Charts