Cup & Handle on 4 hour and Head & Shoulder on 1 Day ,Cup and handle pattern in NEAR Very Bullish,
even we can see Head and Shoulder in 1 day
and BB is very tight
first target 4$
Stop 3$
entry Now
NEARUSDT.PS trade ideas

NEAR/USDT - LONG ----- Welcome, dear followers! -----
- Here is my trading methodology. I trade with a normal system and analysis of resistance and support, as well as price reversal patterns.
- For the record, I do not place a stop loss within my trades. So that I only risk 1.5% of my total capital in order to support the loss due to a price reversal against me.
- If a price reversed against my expectation and touched the drawn line r3, then I transferred targets to the entry point and waited for the price to close at it with a loss equal to almost zero.
- Today's deal is shown in the chart, and here are the entry and exit points below.
-- Support me with numbers and follow up on my account for other deals in the future. Thank you for coming to this part. --
-------------------------------------------------------
⚡️⚡️ NEAR/USDT ⚡️⚡️
Exchange: Binance Futures
Trade Type: Breakout (Long)
Leverage: Cross (2.0X)
Entry Orders:
1) 3.249 - 100.0%
Take-Profit Orders:
1) 3.446 - 70.0%
2) 3.628 - 25.0%
3) 3.904 - 5.0%
Trailing Configuration:
Stop: Breakeven -
Trigger: Target (1)

NEAR usdtthis is wyckoff distribution scheme. and i hit the luna ( on the left ) 118 with that analyse. i know 24-25 is so interesting to reach for near but we'll see what happen... im in long !

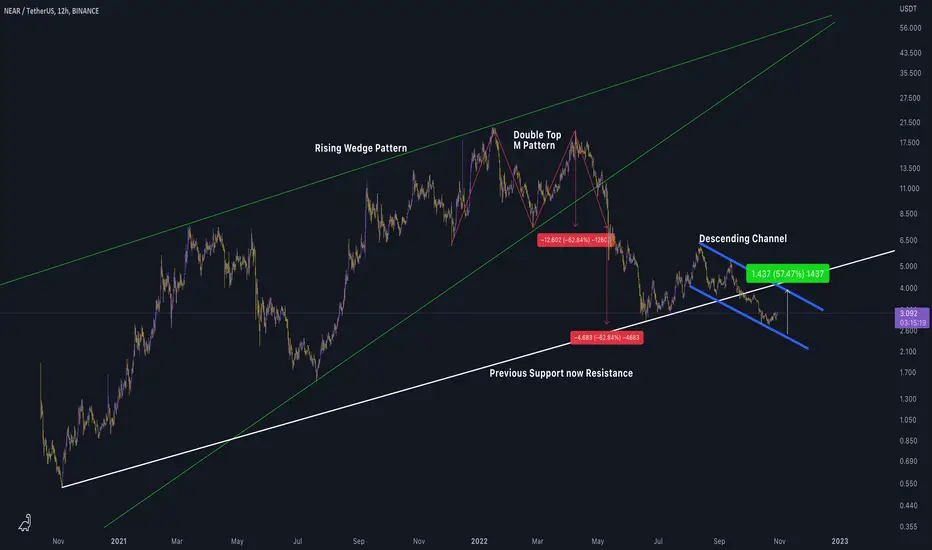
NEAR/USDTI really like LOG for NEAR, as you can see this had a massive rising wedge pattern (green lines), which then formed a double top pattern which I have drawn in red the M pattern, to measure the target of the M pattern you measure it from top to bottom and you can see it exactly went down 62.84%, NEAR then lost a major diagonal support which is the white line, and has now formed a descending channel pattern in the blue lines which could break up to the upside, but as you can see that previous support level is now a major resistance level.
NEARUSD ❕ broke up the downtrendNEAR continued to move in the liquidity zone and broke through the downtrend upwards.
The RSI chart maintains movement in the buy zone on the 4H Timeframe and price has successfully tested 50EMA as support.
I believe that the asset may test the support level, but after overcoming the liquidity zone, the price will go up.

NEAR/USDT buying to hold!Morning guys
Let's take a quick look at NEAR coin. We see that we have reached an important level where we can see a resistance and EMA100 to hold the price back. Well we are waiting for a clean breakout here in order to enter this trade. What do you think?
EMA100 was secured now we need to secure the Resistance zone as well
If you like ideas provided by our team you can show us your support by liking and commenting.
Yours Sincerely,
Swallow Team 🔱
Disclamer:
We are not financial advisors. The content that we share on this website are for educational purposes and are our own personal opinions.

Ascneding Broadening Wedge?what do you guys think? there is a ascending broadening Wedge and resistance at 2.10 tapped three times already..breakout?

long NEAR$NEAR broke though the descending trendline. Bullish movement to resistance level at 3,73$ is likely to happen.

NEAR/USDTNEAR/USDT
I look at this as gold.
A valuable thing and on a very important support.
I think it can grow by 10 to 30 percent from this area.
#NEARUSDT #NEAR #BTCUSDT #BTC #ETHUSDT #DOGE #DOGEUSDT

NEARUSD ❕ uptrendThere is still a downward compression on the chart.
NEAR has formed an upward channel.
Price and RSI have formed a bullish divergence (4H TF)
I expect growth if the asset holds in the channel, further movement will depend on the price reaction to the downtrend line.

NEARUSD LONGPossible upward movement of the pair. Price is currently in a lower bound trading zone with significant volume making stops and holding rejections at the bottom of the price near the 55 period EMA , essential in my strategy for analysis of potential trend continuations. Indicators like Squeeze Momentum and the MACD histogram have turned bullish after their red valley; accompanied by the loss of bearish strength indicated by the ADX rebounding towards the EMA . The MACD lines would be giving a possible buy signal soon. I think you could go looking for the previous high price zone when you see indications of a bounce move higher on the 4-hour chart. In 1 hour timeframes we see that it has broken the bearish structure, forming higher lows than the previous ones.
If you are going to take my opinion into account, please respect the projection time, this is extremely important. If it is not fulfilled in the foreseen time and makes a range, it will be better to close the operation in case it is possible.

NEARUSDTHELLO,
NEAR bullish divergence (macd - RSI - Mom) this good we may see 10 - 15 % up from
not financial advice

Near Protocol Bullish Butterfly pattern / Mac TvBULLISH BUTTERFLY PATTERN
Daily TF
Bullish Confluence
PRZ = possible reversal zone
RSI = Overbought, signal is also below of rsi
Macd = Crossover
FVG = $3.3 area, $4.7 area, and 5.6
Bearish Confluence
maybe Butterfly pattern not yet finish,
it can go down up to $1.9 because of FVG

short NEAR$NEAR bounced off the resistance level. Decline to support level at 2,79$ is likely to happen.

NEAR, 5th wave down?Looks like this corrective EW pattern has played out. Despite global economic uncertaintity, we very well may see some upside in the "near-term"

NEARUSD ❕ trend compressionThere is a decline in trading volume on the NEAR price decline.
The asset is testing 50EMA as support (1H TF).
I expect a bounce in case NEAR is able to fix itself above the liquidity zone.

Another Short Position | Another +200% on NEAROur Last Short Position Closed with over 300% Gain on 10X Lev. , And Now we didn't see any sign of an upward activity so another short position with high risk is available.
R/R : 5.5
Max Gain 25% (10x LEV. =250%)
HOW TO SETUP?
We can have a short position on 3.7-3.6 so the avg. will be 3.65 $ and we will set our Stop-Loss over the previous high (so we don't expect any Higher High in this scenario).
Please don't get in FOMO and also don't panic to avoid losing money in case of any mistakes. your target should be on 1.0 or 1.23 of Extended Fibo so watch for price movements.
The 1st resistance is 3.4 so if the price breaks it we can expect a lower low of 2.85 to 3$. You can Trail your Stop-Loss with Crypto-Bot. Trade or any other Trader Assist Tools to get the Maximum Gain out of this Position.
Good Luck

NEAR Protocol (NEAR) - October 17Hello?
Welcome, traders.
By "following", you can always get new information quickly.
Please also click "Boost".
Have a good day.
-------------------------------------
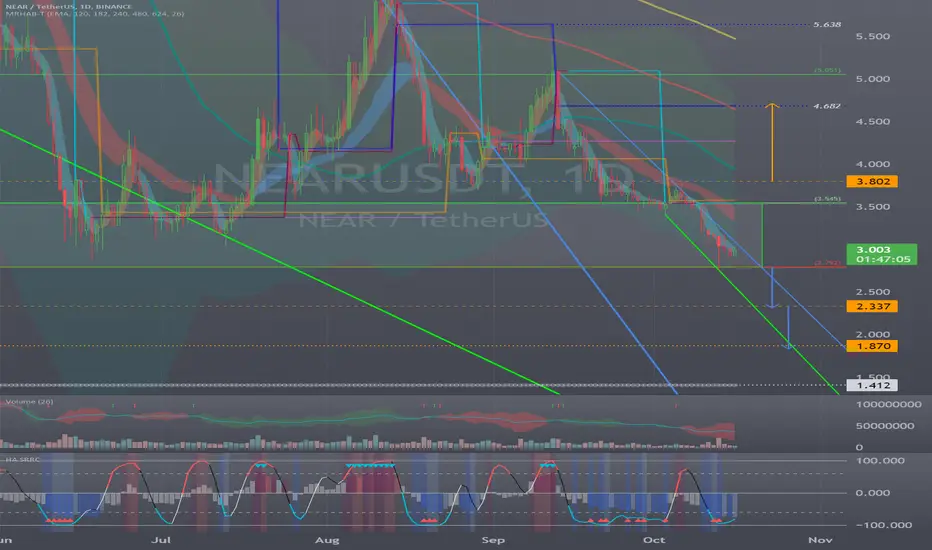
(NEARUSDT 1W Chart)
The key is whether the 2.792-3.545 zone is supported and able to rise.
(1D chart)
If it falls below 2.792, we should see support near 2.337.
If it rises above the 3.545-3.802 section, it is expected to rise to around 4.682.
------------------------------------------------------------ -----------------------------------------------------
** All descriptions are for reference only and do not guarantee a profit or loss in investment.
** If you share this chart, you can use the indicators normally.
** The MRHAB-T indicator contains indicators that indicate support and resistance points.
** SR_R_C indicators are displayed as StochRSI(line), RSI(columns), CCI(bgcolor).
** CCI indicator is expressed as overbought range (CCI > +100) and oversold range (CCI < -100).
(Short-term Stop Loss can be said to be a point where profit and loss can be preserved or additional entry can be made through split trading. It is a short-term investment perspective.)
---------------------------------

✅TS ❕ NEARUSD: support level✅✅ NEAR has reached the support level.
The price has already formed a double top.
Growth is possible.✅
🚀 BUY scenario: long to the resistance area.🚀
----------------------------------------------------------------------------
Remember, there is no place for luck in trading - only strategy!
Thanks for the likes and comments.

NEAR 1D Classic head and shoulder shoulder training. Now what is happening is an inverse movement symmetry where the first top of 3.0792 has already been reached and goes to the top of 4.418 as indicated in the chart.
Spectacular NEAR both for trading due to its high daily trading volume and good for HOLD due to its fundamentals and development.
Global macroeconomic and geopolitical situations justify this drop of 77.45% since its ATH. NEAR recently partnered with Google cloud.
Follow the link.
near.org
Support and resistance on the 1H chart
SUPPORTS: 2.974 / 2.956 / 2.803
RESISTANCES: 3,0083,094 / 3,180

🔥🚀NEAR make false breakout: STRONG BULLISH SIGNAL?Hi friends! NEAR make a DUMP together with another crypto yesterday. Hope you follow the scenario which I published yesterday, coz this manipulation were highly expected.
In this idea we will talk about the another possibility for you to open a trade on the pullbacks and make a profit.
✅ Before the longs, take a look to my previos idea about this altcoin. As I said in that idea, watch BTC. If it show you the bullish signal, all the altcoin go up. It's not happen.
NEAR reach all short targets after the breakout of the channel. Amazing entry point at the test the channel as the resistance. Congrats traders who get profit and close it`s shorts last 2 days.
📊 Now let's talk about my preconditions to open a long:
✅ false breakout of the key level+volume growth
🔥 some pullback to the key level of $2.9
🔥 squeeze to the trendline
🔥 bullish BTC
🚩 The targets:
1. $3.35-3.65 - the closest value area
2. $4.13-4.46 - the value area and strong resistance
3. $5.28 - the key level
🔥My recommendation is to book at least 50-60% of profit. Set your sl at the breakeven when the price reach the 1st target.
💻Friends, press the "boost"🚀 button, write comments and share with your friends - it will be the best THANK YOU.
P.S. Personally, I open an entry if the price shows it according to my strategy.
Always do your analysis before making a trade

