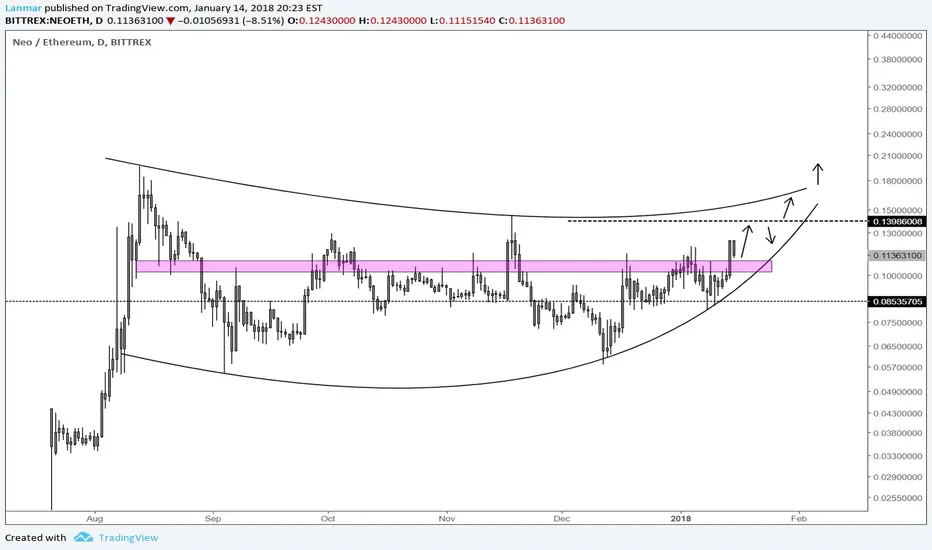
NEOETHIf Neo may go down to a low of around 0.1292 ETH before breaking through the Trendline Resistance (A).
Once it breaks through Trendline Resistance (A). There is a possible price of about 0.145 ETH.
This is a great short term position.
A price of about 0.131 ETH is a decent safe spot for entry.
But keep an eye on if it manages to break through the Trendline Resistance (A).
NEOETH trade ideas

NEO/ETH Possible Short Term Rise Before Down to SupportFirst public post. Noticed continual, repeating triangle patterns lately when doing private analysis for myself. Not fully clear where it will go but if I had to pick a direction short term I'd say a short term spike before it goes down more or settles into another triangle pattern. As you can see it has typically broken out after being pinched into the Descending Triangle Pattern. Many more triangles could be drawn in this area with approx. support levels and downtrend lines. All have at least a temporary spike when they break the triangle even if they headed down afterwards. Although, the rise would be tiny. Leaving this here to recall and asses my TA.
Maybe I'm reading too much into though and my eyes are seeing things that aren't there. We'll see.

NEO/ETH MIGHT be Fixin' ta BustAs the broader crypto market unravels, NEO is holding up relatively well. It is bouncing off the .382 vs BOTH ETH and USD.
It is a decent buy at this time.
HOWEVER...
IF NEO/ETH CLOSES above the red line on a DAILY chart, it will be Fixin' ta Bust and therefore you should buy some at the market.
IF NEO/ETH CLOSES above the red line on a WEEKLY chart, it will very likely have already started to bust and you should buy more at the market.

NEO ETHLETS see where the market will break out... But we know one of the red lines are destionation for sure....

NEO forming cup and handle. Completing Waves. Hitting FibsPerfect time to grab some NEO. Remember to set your stop losses.

NEO/ETH Trend ReversalNEO should go up here shortly. See chart for details. 3 checks say "go"
First Indicator Chart: RSI has crossed over (light blue)
Second Indicator Chart: MACD has crossed over
Third Indicator Chart: 7/25/50 (yellow,red,green) EMA converging in the correct order

NEO is saying Ni Hao to Ethereum NEO is coming up and up again! This coin showed a great potential and i'm seeing it grow and be in the top 3!
This is a long term HODL, the team is great and following the roadmap.
This analysis is showing that there will be a pullback as the RSI showing an overbought coin and waiting for a pull back for a long term entry.
I will update this trade and let you know for the best buy entry
Good luck and trade safe

$neo / $eth
Overall in a level of consolidation
RSI consolidating
BBands still relatively tight. Featured a shakeout earlier w/ a close below the lower band and then bounced back
A couple of patterns forming. Will probably break up at the end of the ascending triangle.
Timeline: < 4 weeks

the "History Strategy"I think that this prediction will work and or the "History Strategy" because if you look at it the chart has repeated it self many times and if you realize its always going down then bouncing back. It is basically repeating history so it is more predictable making this a strategy on were this Crypto will lead in the future

Looks like #NEO needs to fall and come below to complete waveThis would be a great demonstration of the mirror image construction of this kind of correction wave. Buying at the dip would be a bit risky, I would wait for a solid breakout after that first.

Could NEO outperform Ethereum? Neo may be on the cusp of a breakout. I own both, but will add to NEO now and in purple.
I think NEO hits $1000 at some point - either this year or next. And Ethereum hitting $5000, this year.
#1 Crypto Daily NEO/ETH The Strongest? Jan 14 2018The last week Neo has been strong even against the Ethereum.
So what can be expected going forward?
Price has broken above the Cloud on the back of a bullish twist
after being sold off a couple of times by the Weekly R1. It also found
good support by the Weekly S1 on Jan 8. It has been oscillating
around the Monthly pivot point the whole month this far, a level
that has been resistance during the latter part of 2017. (0.10)
Chances are that we will see more of this sideways price action
but there is also a slight chance for a continuation up. This less
likely scenario is marked as an ABCD pattern. This could take price
up to 0.1350. A first sign of continuation would be a close above
the 0.111-0.1130 level. This is just a scenario to keep in mind,
less likely though. To the downside, Bulls do not want price to return
back inside the Cloud on a closing basis, which would likely
push price to the lower end of the Cloud. But this could be a good
buying opportunity for dip buyers, since the projected Cloud is
bullish, and it is unlikely to see a breakout lower with follow through.
Overall, as being a sort of Safe Haven in the Crypto market when
there is a "Risk Off" sentiment, Neo will function on an equal level
to Ethereum. Both are strong and compared to the USD they are
both on a bull run. Currently though with a slight edge for Neo.
The bottom at 0.0550 seems to be the ultimate support for the pair
incase of a full on dump.
If you want to support this channel check out the
profile page at the top for details. Thanks.

ETH - EUR looking for a breakoutHey there,
my first post on this plattform. I identified several signs that let me believe that NEO-ETH is in an healthy bullish trend, looking to break a key resistance level.
It´s possible that the trend forms a double top and goes down from here, but the overall signs and the long lower wicks on the daily inside bars make it more likely to see a break
of the resistance.
let me know what you think - i have doubts on the placement of the stop loss and if i should enter the trade upon break of the level or when the price returns and wants to test the resistance.

NEO ETH on Bittrex I was able to ride the last wave about 2 weeks ago. NEO looks like its going to go for another run. Any thoughts?

NEOETH 4H Long: Bullish Divergence of Price vs. MomentumThe 4H NEOETH chart shows a bullish divergence of price vs. momentum. The momentum indicator shows the speed at which the price is changing - a divergence of price against momentum is an indication that the current trend might reverse.
The oscillator window shows the momentum indicator and an exponential moving average with a length of 9 (EMA9) applied to it. As you can see, the EMA9 is going up.
Besides the price-candles, I applied an EMA9 too to the price to show that currently the closing prices of the candles are going down - a perfect divergence!
My indicator "Jeddingen Divergence v4" shows this kind of divergences on the chart - I surrounded them with black ellipses.
The past two divergences seemed to be very accurate - so the current divergence might be that accurate too. But we all now the saying: "Past Performance Is Not Indicative Of Future Results" - so play it safe and don't put all your eggs in one basket!
The profit target could be 0.113054 (the point where price is expected to hit the blue trendline), but I would suggest to get out earlier, for example at 0.104617 (half-way to the trendline).


NEOETHNEO / ETHEREUM
Look at this zones. After great pump out of the triangle we will see the correction and the next target is supply zone.

Clearly still bullish!This can be read as an update to my previous Idea, referenced here
There was a double bottom, and we have an upward trend reversal confirmation!
We broke through the upper limits of the previously identified channel and *also* through the short-term bearish trendline at the same time. I feel that we might stay *up* from the previous, pre-august, pre-namechange channel.
This would mean we maintain some of the gains from the previous rally, and we are *yet to establish* an upper limit for the new bullish channel we find ourselves in, if the trend line around the 0.0075 mark remains as support.
Advice? Buy and hold.


Neo - Still bullish. Here is why i'm still bullish on neo.
It bounced off of the bearish trendlines heading odwn from its ATH before reaching the supportline derived from price action in the beginning of the year - before the august hype rally.
As you can see, evertyhing above the upper resistance channel line that it broke through on 4th of august is FOMO hype.You can see it tested that very same channel guide today, as it bounced up from support this morning - one month later.
We can assume therefor that Neo has returned to the channel it had been in, before the August 4th hype.
Let's go the NEO news of that date.
Luly 27: Neo founders do an AMA on reddit.
August 10th, this article appears in forbes.
www.forbes.com
Here we can see the next spike on the chart. It bounces off against the line i'm drawing between this spike, and the august 7 one, that again is touched on the 18th.
This line therefor will remain on my chart until the next *silly hype rush* - should it ever go above it again, it's time time to short.
We can even see it show up as short term support after the absolute follly ATH of near .2 ETH/NEO.
(Why am i looking at ETH/NEO? Because they are competing coins, with a geopolitical vector.)
Again, back to the forbes article. Before it publishes, the price of Neo bounces *up* off of the same lines that showed resistance before it broke through around the 4th and then again 5th of august. The same line I now call resistance.
We still haven't answered what happened on the 4th and 5th of august to support this increase in price action.
Huffington Post picked it up on the 12th of August, and indeed we can see another dip being turned into an all-time-high rally, which quickly collapses - any news on the 15th of august to coincide with the beginning of the bull-trap? (I believe we are all familiar enough with the 'anatomy of a bubble'-chart to see what i mean by that. if not, make sure you become familiar.)
Ayway, I'm kind of done with finding the news on this. There's a chance the bearish trendline drawn between and extended from the 16th and 23rd of august's peaks will drive the price down onto proper longterm support - but we will break through that one and resume the channel no later than the 9th of september.

NEO - "Bounce Between Mid Support & Resistance"NEO to bounce between mid-range support and resistance and breakout either down to lower support or up to upper resistance

NEO vs ETH - Buy NEO now! #NEO #ANS #ETHEREUM BK's Boss Mode Prediction:
NEO will outperform ETH
AND
Will breakout by Nov 1 2017.
Buy now and ride the Money Train to Cash Town!!
ALL ABOOOOARD!!
