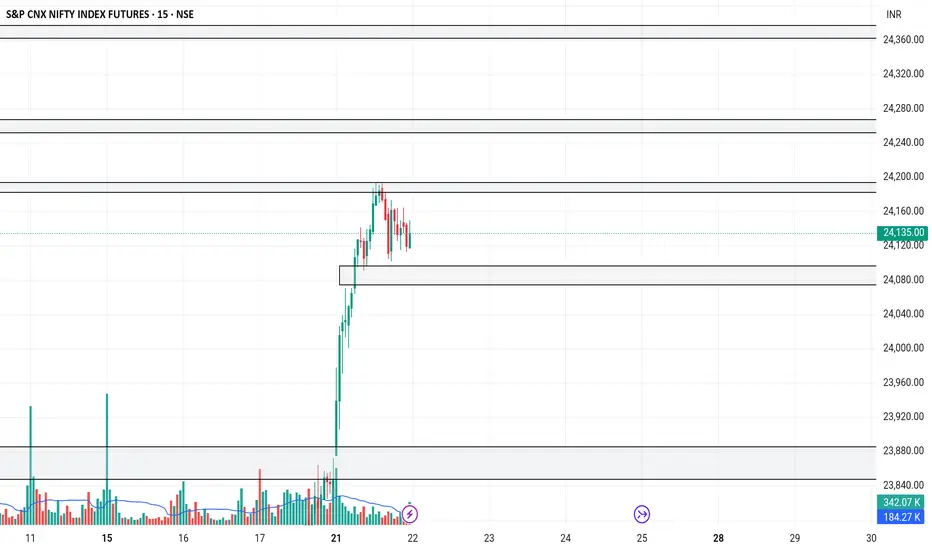
Nifty 50 next week is crucialGift Nifty showing resistance in weekly chart. Avoid making new long position until 24110. Even after that please look watch as it might be a fake breakout too.
NIFTYN2023 trade ideas

NIFTYNifty levels are based on imbalances
1. gapup 23900 long
2. 23900-23750 trade breakout
3. gapdown 23750 short

Nifty Futures Daily Trend analysis for April 17, 2025As mentioned in my post yesterday (April 15, 2025), we have been eyeing the Nifty Futures resistance level at 23,460. Today, the price is approaching this level. Our Masters Cycle has confirmed a buy signal today, with a stop-loss set at 21,859.
Now, how should we approach intraday trading for tomorrow (April 17, 2025)?
As highlighted in yesterday’s update, our Future Candle Reversal Projection indicator has signaled a reversal day for April 17. Additionally, the Dynamic Candle Reversal indicator (note the small blue line plotted today) has confirmed an intraday bearish setup for tomorrow.
Considering these signals, we will focus on intraday shorting opportunities for April 17. However, for positional trades, we continue to maintain a bullish bias.
Disclaimer:
The views shared here reflect my personal analysis and are intended for educational purposes only. Market conditions may differ in real-time. If you are a trader, please conduct your own research and analysis before making any trading decisions. Always ensure that you trade with a proper Stop-Loss in place.

Gift Nifty Will the laugh continue ?Gift Nifty 23293 - Will the laugh continue ? Has Hidden divergence in indicator and V bottom pattern with Pullback test in progress. the neckline 23240 has got broken and let see if the laugh could continue

Nifty Futures intraday analysis for April 17, 2025As explained yesterday, I foresee a bearish trend and the support1 zone at 23358 and Support 2 is at 23313. A breakout below 23313 will bring the Nifty Futures down to 23237. Our Market Timing indicator is in line to our analysis.
This is just my view for the day. Traders must use their own technical study before entering into trades. Stop-Loss is a must for every trade.

Nifty50 28k if crosses 24350High possibility we can take long position if nifty 50 crosses 24350 and retrace it back and take support at around 24300 to 24350 and bounce. Assuming high possibility nifty reaching 28k after this resistance.

NIFTYNifty levels are based on imbalances
1. gapup 23450 long
2. 23450-23350 trade breakout
3. gapdown 23350 shoprt

NIFTYNifty levels are based on imbalances
1. gapup 23000 long
2. 23000-22825 trade breakout
3. gapdown 22825 short
NIFTY Futures | Liquidity Sweep + Bullish Structure Shift NIFTY Futures (15min) – Technical Analysis using SMC | ICT | Price Action
1. Price took liquidity below 22,405, sweeping sell-side stops — a common smart money move
before reversing.
2. A clear market structure shift occurred as price broke previous swing highs after the liquidity
grab.
3. Price is currently reacting from a bullish order block between 22,440 – 22,480, showing signs
of accumulation.
4. The entry aligns with ICT’s Optimal Trade Entry (OTE) zone near the 61.8% Fibonacci
retracement level.
5. Price was consolidating in a tight range (5min) and has now started breaking out to the
upside.
6. There is a visible imbalance / fair value gaps between 22,760 – 22,920 that price may look to
fill.
7. Immediate targets are:
- 22,760 (start of imbalance)
- 22,920 (buy-side liquidity above recent highs)
- 23,250 (clean inefficiency zone)
- 23,310 (major resistance / previous high)
8. The setup becomes invalid if price breaks and closes below 22,405 — that’s the stop-loss level.
Thanks for your time..

Nifty Daily view on Friday (April 11, 2025)According to my analysis, the Nifty is still bearish on a daily basis. However, I foresee an opportunity in the bullish signals on April 11, 2025. Since I am considering the gaps on the either direction, traders should follow technical analysis before entering into trades.

Nifty outlooks for next week and overall draw on liquidityExpecting all out bullishness on Nifty 50 Index. 25500+

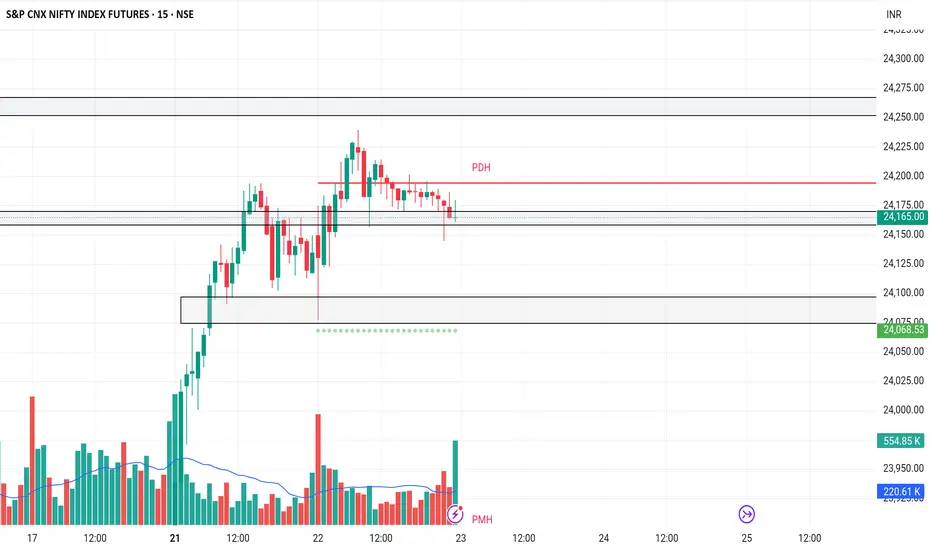
NIFTYNifty levels are based on imbalances
1. gapup 24250 long
2. 24250-24150 trade breakout
3. gapdown 24150 short
Nifty Futures Intraday Trend Analysis for April 22, 2025The primary trend remains bullish as Nifty Futures continues to trade above the Sine Wave. However, Market Timing is indicating a bearish signal, which is further confirmed by the MastersCycleSignal indicator. If the price moves lower, the first support level is at 23,875, followed by a stronger support at 23,628 (Sine Wave level).
This is my personal view. Traders are advised to rely on their technical analysis and always trade with a Stop-Loss.

NIFTYNifty levels are based on imbalances
1. gapup 24200 long
2. 24200-q24100 trade breakout
3. gapdown 24100 short
Nifty Futures Daily Trend AnalysisNifty Futures has been in an uptrend since closing above the SSL level at 23,018. The MastersCycleSignal indicator is currently acting as resistance at 23,460. A breakout above this level could open the path toward the next resistance at 23,801.
The Future Candle Reversal Projection indicator highlights potential upcoming intraday opportunities that contrast with the intraday trend of the day prior to the reversal. This is my personal view and shared for educational purposes only. Please conduct your own technical analysis and always trade with a stop-loss.

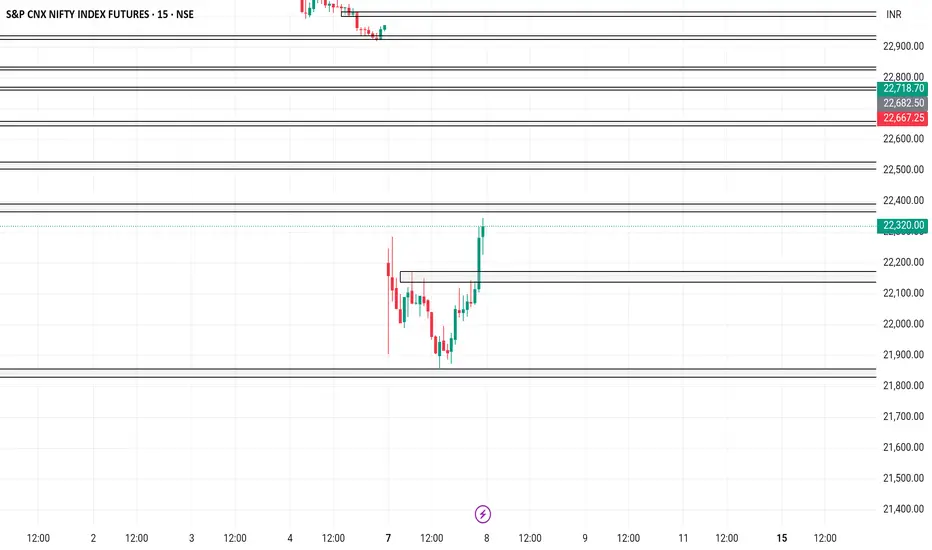
NIFTYNifty levels are based on imbalances
1. gapup 22550 long
2. 22550-22400 trade breakout
3. gapdown 22400 short

NIFTYNifty levels are based on imbalances
1. gapup 22760 long
2. 22760-22460 trade breakout
3. ga [pdown 22460 short

Nifty Yearly Lows in Place. Time for recovery towards 25000Massive meltdown towards the sellside. Time for all out displacement towards the internal buyside. I feel the yearly lows are in place. Best time to invest for SIP and mutual funds

NIFTYNifty levels are based on imbalances
1. gapup 22400 long
2. 22400-22250 trade breakout
3. gapdown 22250 short
Nifty Futures intraday trend analysis on April 7th & 8thAccording to my Trend Analysis, on 7th Nifty Futures is likely to bounce back and the raise will not sustain on April 8th. The levels provided in the chart are calculated without taking Gaps into account. In the first 15mts on 7th April, there is a bullish candle formation. Trade with Stop-Loss.

Gift Nifty Support & ResistanceCurrent Context:
The last price shown on the chart is approximately 22,491.0.
The 50-period Exponential Moving Average (EMA 50) is at 23,142.2.
The Bollinger Bands (20, 2) show:
Upper Band: 23,999.4
Middle Band (SMA 20): 23,084.9
Lower Band: 22,170.4
Projected Resistance Levels:
Resistance 1: Located between approximately 23,767.5 and 24,000.0. This zone represents the first significant hurdle for an upward price movement. The Upper Bollinger Band (23,999.4) is also near the top of this range.
Resistance 2: Situated between approximately 24,783.0 and 25,000.0. This is the next major area where selling pressure might increase if the price breaks through Resistance 1.
Resistance 3: The highest resistance zone marked is between approximately 26,326.0 and 26,440.5. This level corresponds to the previous major highs seen on the chart around October/November 2024.
Projected Support Levels:
Sub Support 4: Around 22,504.0. This is the immediate minor support level just above the current price.
Sub Support 3: Around 22,745.0.
Sub Support 2: While not explicitly marked with a value line, it appears visually just below the 23,034.0 level.
Sub Support 1: Located between approximately 23,034.0 and 23,250.0. The Middle Bollinger Band (23,084.9) and the EMA 50 (23,142.2) fall within or very close to this range, potentially strengthening it as a support/resistance pivot area.
Support 1: A significant support zone marked between approximately 22,144.5 and 22,320.5. The Lower Bollinger Band (22,170.4) is near the bottom of this range.
Support 2: Marked near 21,947.0 (partially labelled "Support" on the chart). This represents a lower major support level.
In summary, the price is currently near Sub Support 4. Key areas to watch are the cluster of Sub Supports 1-3 and the moving averages above the current price, and the major Support 1 zone below. On the upside, Resistance 1 around 23,767.5-24,000 presents the first major challenge.

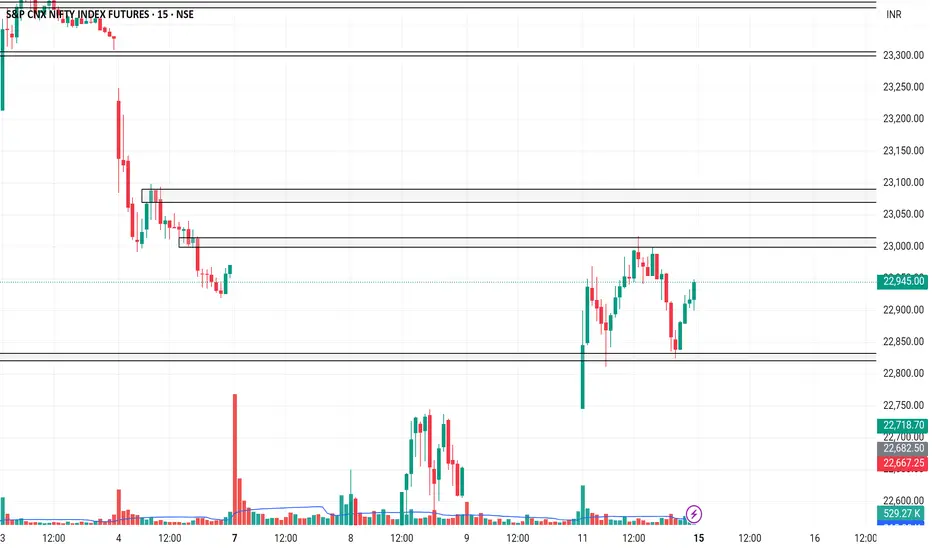
NIFTYNifty levels are based on imbalances
1. gapup 23000 long
2. 23000-22920 trade breakout
3. gapdown 22920 short

TIME TO BUY NIFTY AGAIN!! NIFTY SEEMS POSITIVEHello All!!
I am back with totally different opinion on Nifty Futures, I had checked with Media and some published articles, most of all are Bearish On Nifty for coming day!!
But I don't think so.......
Today on 04-04-2025, Nifty is negative by more than -1.5%.
I think it is very right time to buy Nifty!!
Nifty futures CMP:22950.00
Nifty has beached its valuable support at 23,270.00
Now, Nifty's next big support is at 22,930.00
RSI is just above it's 40 Mark level!!
If RSI manages to hold that 40 Mark level, Nifty is going to switch it's direction and start moving upwards.
Simple terms: Risk to Reward ratio is most favorable at current market price.
So, if Nifty holds 22,930.00 level and RSI holds it's 40 Mark level, Bulls are back in market.
Target: 24,000.00 with in this month.
Stoploss: Mange as per your risk tolerance capacity.
Let's hope for the best!!
Be cautious, Market is teaching us something which is not so often!!
Note: This is just my attempt to Analyze Nifty chart, I don't recommend any one to trade or invest based on this study. This is just of educational purpose.
